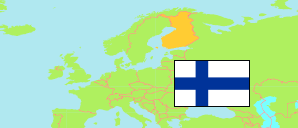
Rauma
Municipality in Satakunta
Municipality
The population development of Rauma.
| Name | Status | Population Estimate 2011-12-31 | Population Estimate 2016-12-31 | Population Estimate 2021-12-31 | Population Estimate 2024-12-31 | |
|---|---|---|---|---|---|---|
| Rauma | Municipality | 39,820 | 39,614 | 38,959 | 38,968 | → |
| Satakunta | Region | 225,302 | 221,481 | 214,281 | 211,261 |
Contents: Settlements
The population development of the settlements in Rauma.
| Name | Status | Municipality | Population Estimate 2011-12-31 | Population Estimate 2016-12-31 | Population Estimate 2021-12-31 | Population Estimate 2024-12-31 | |
|---|---|---|---|---|---|---|---|
| Kodisjoki | Village | Rauma | 367 | 332 | 335 | 311 | → |
| Kolla | Settlement | Rauma | 537 | 526 | 486 | 459 | → |
| Lappi | Village | Rauma | 1,589 | 1,499 | 1,484 | 1,455 | → |
| Rauma | Central Locality | Rauma | 33,455 | 33,552 | 33,302 | 33,377 | → |
| Vasarainen | Settlement | Rauma | 408 | 395 | 371 | 364 | → |
Source: Statistics Finland.
Explanation: Settlements according to the 2024 definition.