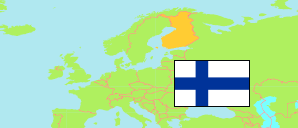
Kinnula
in Kinnula (Central Finland)
Contents: Village
The population development of Kinnula as well as related information and services (weather, Wikipedia, Google, images).
| Name | Municipality | Population Estimate 2011-12-31 | Population Estimate 2016-12-31 | Population Estimate 2021-12-31 | Population Estimate 2024-12-31 | |
|---|---|---|---|---|---|---|
| Kinnula | Kinnula | 932 | 857 | 824 | 787 | → |
Source: Statistics Finland.
Explanation: Settlements according to the 2024 definition.
Further information about the population structure:
| Gender (E 2024) | |
|---|---|
| Males | 395 |
| Females | 392 |
| Age Groups (E 2024) | |
|---|---|
| 0-17 years | 160 |
| 18-64 years | 315 |
| 65+ years | 312 |
| Age Distribution (E 2024) | |
|---|---|
| 90+ years | 19 |
| 80-89 years | 69 |
| 70-79 years | 154 |
| 60-69 years | 132 |
| 50-59 years | 80 |
| 40-49 years | 56 |
| 30-39 years | 59 |
| 20-29 years | 48 |
| 10-19 years | 83 |
| 0-9 years | 87 |