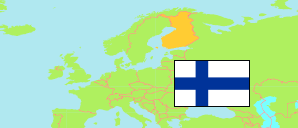
Kainuu
Region in Finland
Contents: Subdivision
The population development in Kainuu as well as related information and services (Wikipedia, Google, images).
| Name | Status | Population Estimate 1980-12-31 | Population Estimate 1990-12-31 | Population Estimate 2000-12-31 | Population Estimate 2010-12-31 | Population Estimate 2020-12-31 | Population Estimate 2024-12-31 | |
|---|---|---|---|---|---|---|---|---|
| Kainuu | Region | 94,401 | 92,459 | 85,736 | 78,703 | 71,664 | 69,639 | |
| Hyrynsalmi | Municipality | 4,428 | 4,066 | 3,486 | 2,736 | 2,199 | 2,002 | → |
| Kajaani | Municipality | 38,016 | 39,577 | 38,912 | 38,157 | 36,569 | 36,433 | → |
| Kuhmo | Municipality | 13,900 | 12,878 | 11,167 | 9,492 | 8,042 | 7,483 | → |
| Paltamo | Municipality | 5,474 | 5,056 | 4,420 | 3,884 | 3,233 | 2,990 | → |
| Puolanka | Municipality | 5,327 | 4,620 | 3,846 | 3,063 | 2,491 | 2,345 | → |
| Ristijärvi | Municipality | 2,469 | 2,150 | 1,796 | 1,513 | 1,235 | 1,163 | → |
| Sotkamo | Municipality | 11,430 | 11,603 | 11,106 | 10,702 | 10,301 | 10,185 | → |
| Suomussalmi | Municipality | 13,357 | 12,509 | 11,003 | 9,156 | 7,594 | 7,038 | → |
| Suomi [Finland] | Republic | 4,787,778 | 4,998,478 | 5,181,115 | 5,375,276 | 5,533,793 | 5,635,971 |
Source: Statistics Finland.
Explanation: Regions and municipalities in the boundaries of 1 January 2025.
Further information about the population structure:
| Gender (E 2024) | |
|---|---|
| Males | 35,339 |
| Females | 34,300 |
| Age Groups (E 2024) | |
|---|---|
| 0-17 years | 11,189 |
| 18-64 years | 36,684 |
| 65+ years | 21,766 |
| Age Distribution (E 2024) | |
|---|---|
| 90+ years | 891 |
| 80-89 years | 4,449 |
| 70-79 years | 10,488 |
| 60-69 years | 11,577 |
| 50-59 years | 8,148 |
| 40-49 years | 7,851 |
| 30-39 years | 7,507 |
| 20-29 years | 5,986 |
| 10-19 years | 7,606 |
| 0-9 years | 5,136 |
| Citizenship (E 2024) | |
|---|---|
| Finland | 66,442 |
| Europe | 1,699 |
| Other Citizenship | 1,498 |
| Country of Birth (E 2024) | |
|---|---|
| Finland | 65,399 |
| Europe | 2,491 |
| Other Country | 1,749 |
| Language (E 2024) | |
|---|---|
| Finnish | 65,472 |
| Swedish | 81 |
| Sami | 4 |
| Other language | 4,082 |
| Urbanization (E 2023) | |
|---|---|
| Inner urban | 15,719 |
| Outer urban | 13,714 |
| Peri-urban | 3,109 |
| Rural centers | 10,995 |
| Rural near urban areas | 2,840 |
| Rural heartland | 3,860 |
| Sparsely populated | 19,072 |