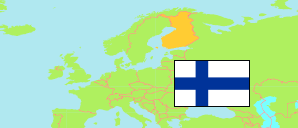
Pohjanmaa
Region in Finland
Contents: Subdivision
The population development in Pohjanmaa as well as related information and services (Wikipedia, Google, images).
| Name | Status | Population Estimate 1980-12-31 | Population Estimate 1990-12-31 | Population Estimate 2000-12-31 | Population Estimate 2010-12-31 | Population Estimate 2020-12-31 | Population Estimate 2024-12-31 | |
|---|---|---|---|---|---|---|---|---|
| Pohjanmaa [Ostrobothnia] | Region | 163,556 | 167,108 | 168,077 | 172,981 | 175,816 | 178,749 | |
| Jakobstad (Pietarsaari) | Municipality | 20,700 | 19,883 | 19,636 | 19,656 | 19,066 | 19,576 | → |
| Kaskinen (Kaskö) | Municipality | 1,914 | 1,780 | 1,564 | 1,429 | 1,278 | 1,241 | → |
| Korsholm (Mustasaari) | Municipality | 13,693 | 16,123 | 16,614 | 18,637 | 19,453 | 19,738 | → |
| Korsnäs | Municipality | 2,320 | 2,310 | 2,246 | 2,260 | 2,068 | 1,986 | → |
| Kristinestad (Kristiinankaupunki) | Municipality | 9,043 | 8,839 | 8,084 | 7,157 | 6,404 | 6,121 | → |
| Kronoby (Kruunupyy) | Municipality | 7,008 | 7,054 | 6,846 | 6,731 | 6,416 | 6,342 | → |
| Laihia | Municipality | 7,028 | 7,604 | 7,414 | 7,870 | 7,996 | 7,656 | → |
| Larsmo (Luoto) | Municipality | 3,110 | 3,664 | 4,111 | 4,816 | 5,534 | 5,884 | → |
| Malax (Maalahti) | Municipality | 5,704 | 5,939 | 5,638 | 5,605 | 5,451 | 5,415 | → |
| Närpes (Närpiö) | Municipality | 10,816 | 10,490 | 9,769 | 9,435 | 9,558 | 9,554 | → |
| Nykarleby (Uusikaarlepyy) | Municipality | 7,537 | 7,727 | 7,492 | 7,458 | 7,479 | 7,439 | → |
| Pedersöre (Pedersören kunta) | Municipality | 8,696 | 9,874 | 10,258 | 10,893 | 11,174 | 11,226 | → |
| Vaasa (Vasa; incl. Vähäkyrö) | Municipality | 58,335 | 58,394 | 61,470 | 64,345 | 67,551 | 70,361 | → |
| Vörå (Vöyri) | Municipality | 7,652 | 7,427 | 6,935 | 6,689 | 6,388 | 6,210 | → |
| Suomi [Finland] | Republic | 4,787,778 | 4,998,478 | 5,181,115 | 5,375,276 | 5,533,793 | 5,635,971 |
Source: Statistics Finland.
Explanation: Regions and municipalities in the boundaries of 1 January 2025.
Further information about the population structure:
| Gender (E 2024) | |
|---|---|
| Males | 90,756 |
| Females | 87,993 |
| Age Groups (E 2024) | |
|---|---|
| 0-17 years | 35,269 |
| 18-64 years | 101,200 |
| 65+ years | 42,280 |
| Age Distribution (E 2024) | |
|---|---|
| 90+ years | 2,318 |
| 80-89 years | 9,652 |
| 70-79 years | 20,272 |
| 60-69 years | 20,301 |
| 50-59 years | 20,310 |
| 40-49 years | 22,056 |
| 30-39 years | 22,535 |
| 20-29 years | 21,836 |
| 10-19 years | 21,757 |
| 0-9 years | 17,712 |
| Citizenship (E 2024) | |
|---|---|
| Finland | 164,017 |
| Europe | 6,420 |
| Foreign citizenship | 8,312 |
| Country of Birth (E 2024) | |
|---|---|
| Finland | 157,890 |
| Europe | 9,909 |
| Other country | 10,950 |
| Language (E 2024) | |
|---|---|
| Finnish | 71,269 |
| Swedish | 88,370 |
| Sami | 6 |
| Other language | 19,104 |
| Urbanization (E 2023) | |
|---|---|
| Inner urban | 42,724 |
| Outer urban | 44,191 |
| Peri-urban | 21,297 |
| Rural near urban areas | 29,805 |
| Rural heartland | 35,512 |
| Sparsely populated | 2,632 |
