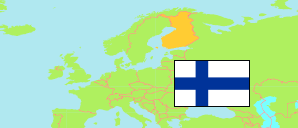
Pohjois-Karjala
Region in Finland
Contents: Subdivision
The population development in Pohjois-Karjala as well as related information and services (Wikipedia, Google, images).
| Name | Status | Population Estimate 1980-12-31 | Population Estimate 1990-12-31 | Population Estimate 2000-12-31 | Population Estimate 2010-12-31 | Population Estimate 2020-12-31 | Population Estimate 2024-12-31 | |
|---|---|---|---|---|---|---|---|---|
| Pohjois-Karjala [North Karelia] | Region | 182,435 | 182,200 | 176,187 | 169,778 | 163,537 | 162,091 | |
| Heinävesi | Municipality | 5,785 | 5,364 | 4,578 | 3,912 | 3,196 | 2,929 | → |
| Ilomantsi | Municipality | 8,753 | 8,054 | 7,129 | 5,883 | 4,749 | 4,382 | → |
| Joensuu | Municipality | 63,969 | 67,363 | 71,013 | 73,305 | 76,935 | 78,741 | → |
| Juuka | Municipality | 7,875 | 7,317 | 6,583 | 5,589 | 4,527 | 4,160 | → |
| Kitee (incl. Kesälahti) | Municipality | 14,546 | 14,514 | 13,283 | 11,666 | 9,933 | 9,566 | → |
| Kontiolahti | Municipality | 8,351 | 10,450 | 11,517 | 13,722 | 14,857 | 15,071 | → |
| Lieksa | Municipality | 19,157 | 17,527 | 15,208 | 12,687 | 10,719 | 10,049 | → |
| Liperi | Municipality | 10,737 | 11,500 | 11,479 | 12,271 | 11,994 | 11,913 | → |
| Nurmes (incl. Valtimo) | Municipality | 15,569 | 14,581 | 12,783 | 10,966 | 9,501 | 8,980 | → |
| Outokumpu | Municipality | 10,312 | 9,307 | 8,155 | 7,411 | 6,552 | 6,444 | → |
| Polvijärvi | Municipality | 6,167 | 6,001 | 5,411 | 4,804 | 4,201 | 3,999 | → |
| Rääkkylä | Municipality | 4,063 | 3,556 | 3,175 | 2,554 | 2,066 | 1,881 | → |
| Tohmajärvi | Municipality | 7,151 | 6,666 | 5,873 | 5,008 | 4,307 | 3,976 | → |
| Suomi [Finland] | Republic | 4,787,778 | 4,998,478 | 5,181,115 | 5,375,276 | 5,533,793 | 5,635,971 |
Source: Statistics Finland.
Explanation: Regions and municipalities in the boundaries of 1 January 2025.
Further information about the population structure:
| Gender (E 2024) | |
|---|---|
| Males | 80,810 |
| Females | 81,281 |
| Age Groups (E 2024) | |
|---|---|
| 0-17 years | 25,624 |
| 18-64 years | 89,116 |
| 65+ years | 47,351 |
| Age Distribution (E 2024) | |
|---|---|
| 90+ years | 2,001 |
| 80-89 years | 9,532 |
| 70-79 years | 22,861 |
| 60-69 years | 24,782 |
| 50-59 years | 17,950 |
| 40-49 years | 18,462 |
| 30-39 years | 18,900 |
| 20-29 years | 18,505 |
| 10-19 years | 16,841 |
| 0-9 years | 12,257 |
| Citizenship (E 2024) | |
|---|---|
| Finland | 154,347 |
| Europe | 4,640 |
| Other Citizenship | 3,104 |
| Country of Birth (E 2024) | |
|---|---|
| Finland | 151,425 |
| Europe | 7,003 |
| Other Country | 3,663 |
| Language (E 2024) | |
|---|---|
| Finnish | 151,254 |
| Swedish | 162 |
| Sami | 7 |
| Other language | 10,668 |
| Urbanization (E 2023) | |
|---|---|
| Inner urban | 32,910 |
| Outer urban | 31,443 |
| Peri-urban | 18,984 |
| Rural centers | 11,023 |
| Rural near urban areas | 16,021 |
| Rural heartland | 24,602 |
| Sparsely populated | 25,340 |