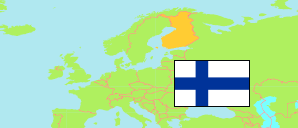
Etelä-Savo
Region in Finland
Contents: Subdivision
The population development in Etelä-Savo as well as related information and services (Wikipedia, Google, images).
| Name | Status | Population Estimate 1980-12-31 | Population Estimate 1990-12-31 | Population Estimate 2000-12-31 | Population Estimate 2010-12-31 | Population Estimate 2020-12-31 | Population Estimate 2024-12-31 | |
|---|---|---|---|---|---|---|---|---|
| Etelä-Savo [Southern Savonia] | Region | 163,671 | 163,462 | 156,117 | 146,166 | 132,702 | 129,376 | |
| Enonkoski | Municipality | 2,029 | 2,217 | 1,871 | 1,615 | 1,369 | 1,288 | → |
| Hirvensalmi | Municipality | 3,165 | 2,835 | 2,666 | 2,439 | 2,156 | 2,059 | → |
| Juva | Municipality | 9,025 | 8,435 | 7,671 | 6,962 | 5,932 | 5,674 | → |
| Kangasniemi | Municipality | 7,551 | 7,266 | 6,679 | 5,964 | 5,312 | 5,062 | → |
| Mäntyharju (incl. Pertunmaa) | Municipality | 11,024 | 10,273 | 9,309 | 8,392 | 7,330 | 7,057 | → |
| Mikkeli (incl. Ristiina & Suomenniemi) | Municipality | 52,505 | 54,404 | 55,222 | 54,455 | 52,583 | 51,890 | → |
| Pieksämäki | Municipality | 23,781 | 24,128 | 22,040 | 19,869 | 17,375 | 17,178 | → |
| Puumala | Municipality | 3,686 | 3,431 | 3,041 | 2,477 | 2,137 | 2,101 | → |
| Rantasalmi | Municipality | 5,473 | 5,191 | 4,587 | 3,996 | 3,364 | 3,246 | → |
| Savonlinna (incl. Kerimäki & Punkaharju) | Municipality | 41,053 | 41,359 | 39,575 | 37,059 | 32,662 | 31,460 | → |
| Sulkava | Municipality | 4,379 | 3,923 | 3,456 | 2,938 | 2,482 | 2,361 | → |
| Suomi [Finland] | Republic | 4,787,778 | 4,998,478 | 5,181,115 | 5,375,276 | 5,533,793 | 5,635,971 |
Source: Statistics Finland.
Explanation: Regions and municipalities in the boundaries of 1 January 2025.
Further information about the population structure:
| Gender (E 2024) | |
|---|---|
| Males | 63,799 |
| Females | 65,577 |
| Age Groups (E 2024) | |
|---|---|
| 0-17 years | 18,653 |
| 18-64 years | 66,831 |
| 65+ years | 43,892 |
| Age Distribution (E 2024) | |
|---|---|
| 90+ years | 1,996 |
| 80-89 years | 9,589 |
| 70-79 years | 21,116 |
| 60-69 years | 21,699 |
| 50-59 years | 16,110 |
| 40-49 years | 13,922 |
| 30-39 years | 13,133 |
| 20-29 years | 10,530 |
| 10-19 years | 12,566 |
| 0-9 years | 8,715 |
| Citizenship (E 2024) | |
|---|---|
| Finland | 123,786 |
| Europe | 3,520 |
| Foreign citizenship | 2,070 |
| Country of Birth (E 2024) | |
|---|---|
| Finland | 121,802 |
| Europe | 4,888 |
| Other country | 2,686 |
| Language (E 2024) | |
|---|---|
| Finnish | 121,607 |
| Swedish | 222 |
| Sami | 2 |
| Other language | 7,545 |
| Urbanization (E 2023) | |
|---|---|
| Inner urban | 22,635 |
| Outer urban | 32,598 |
| Peri-urban | 7,686 |
| Rural centers | 12,400 |
| Rural near urban areas | 9,012 |
| Rural heartland | 7,494 |
| Sparsely populated | 36,360 |
