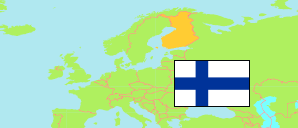
Päijät-Häme
Region in Finland
Contents: Subdivision
The population development in Päijät-Häme as well as related information and services (Wikipedia, Google, images).
| Name | Status | Population Estimate 1980-12-31 | Population Estimate 1990-12-31 | Population Estimate 2000-12-31 | Population Estimate 2010-12-31 | Population Estimate 2020-12-31 | Population Estimate 2024-12-31 | |
|---|---|---|---|---|---|---|---|---|
| Päijät-Häme [Päijänne Tavastia] | Region | 200,352 | 204,901 | 204,912 | 208,777 | 205,771 | 204,635 | |
| Asikkala | Municipality | 8,251 | 8,822 | 8,644 | 8,552 | 8,059 | 7,889 | → |
| Hartola | Municipality | 4,588 | 4,352 | 3,837 | 3,355 | 2,655 | 2,482 | → |
| Heinola | Municipality | 21,441 | 22,255 | 21,178 | 20,258 | 18,497 | 17,829 | → |
| Hollola (incl. Hämeenkoski) | Municipality | 18,733 | 22,236 | 22,592 | 24,106 | 23,251 | 22,849 | → |
| Iitti | Municipality | 7,770 | 7,889 | 7,534 | 7,005 | 6,625 | 6,401 | → |
| Kärkölä | Municipality | 5,051 | 5,343 | 5,048 | 4,882 | 4,326 | 4,093 | → |
| Lahti (incl. Nastola) | Municipality | 108,631 | 108,272 | 111,656 | 116,582 | 119,984 | 121,337 | → |
| Orimattila | Municipality | 15,184 | 15,805 | 15,629 | 16,309 | 15,882 | 15,651 | → |
| Padasjoki | Municipality | 4,613 | 4,400 | 3,879 | 3,423 | 2,861 | 2,676 | → |
| Sysmä | Municipality | 6,090 | 5,527 | 4,915 | 4,305 | 3,631 | 3,428 | → |
| Suomi [Finland] | Republic | 4,787,778 | 4,998,478 | 5,181,115 | 5,375,276 | 5,533,793 | 5,635,971 |
Source: Statistics Finland.
Explanation: Regions and municipalities in the boundaries of 1 January 2025.
Further information about the population structure:
| Gender (E 2024) | |
|---|---|
| Males | 100,113 |
| Females | 104,522 |
| Age Groups (E 2024) | |
|---|---|
| 0-17 years | 33,837 |
| 18-64 years | 112,283 |
| 65+ years | 58,515 |
| Age Distribution (E 2024) | |
|---|---|
| 90+ years | 2,492 |
| 80-89 years | 12,709 |
| 70-79 years | 29,061 |
| 60-69 years | 28,619 |
| 50-59 years | 25,819 |
| 40-49 years | 24,799 |
| 30-39 years | 23,614 |
| 20-29 years | 19,078 |
| 10-19 years | 22,220 |
| 0-9 years | 16,224 |
| Citizenship (E 2024) | |
|---|---|
| Finland | 193,867 |
| Europe | 6,112 |
| Foreign citizenship | 4,656 |
| Country of Birth (E 2024) | |
|---|---|
| Finland | 188,826 |
| Europe | 9,451 |
| Other country | 6,358 |
| Language (E 2024) | |
|---|---|
| Finnish | 187,790 |
| Swedish | 818 |
| Sami | 31 |
| Other language | 15,996 |
| Urbanization (E 2023) | |
|---|---|
| Inner urban | 69,370 |
| Outer urban | 61,321 |
| Peri-urban | 31,729 |
| Rural centers | 8,836 |
| Rural near urban areas | 16,556 |
| Rural heartland | 12,400 |
| Sparsely populated | 1,942 |
