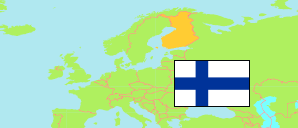
Satakunta
Region in Finland
Contents: Subdivision
The population development in Satakunta as well as related information and services (Wikipedia, Google, images).
| Name | Status | Population Estimate 1980-12-31 | Population Estimate 1990-12-31 | Population Estimate 2000-12-31 | Population Estimate 2010-12-31 | Population Estimate 2020-12-31 | Population Estimate 2024-12-31 | |
|---|---|---|---|---|---|---|---|---|
| Satakunta | Region | 243,839 | 240,777 | 232,569 | 225,762 | 215,416 | 211,261 | |
| Eura | Municipality | 13,729 | 13,406 | 12,957 | 12,507 | 11,483 | 11,084 | → |
| Eurajoki (incl. Luvia) | Municipality | 9,017 | 9,554 | 9,233 | 9,245 | 9,452 | 9,052 | → |
| Harjavalta | Municipality | 8,871 | 8,678 | 7,877 | 7,540 | 6,869 | 6,647 | → |
| Huittinen | Municipality | 11,650 | 11,429 | 10,983 | 10,663 | 9,937 | 9,555 | → |
| Jämijärvi | Municipality | 2,506 | 2,421 | 2,308 | 2,041 | 1,707 | 1,658 | → |
| Kankaanpää (incl. Honkajoki) | Municipality | 16,075 | 15,925 | 15,188 | 14,013 | 12,758 | 12,478 | → |
| Karvia | Municipality | 3,728 | 3,342 | 3,008 | 2,643 | 2,322 | 2,170 | → |
| Kokemäki | Municipality | 9,869 | 9,483 | 8,714 | 7,987 | 7,013 | 6,668 | → |
| Merikarvia | Municipality | 4,150 | 4,187 | 3,811 | 3,347 | 3,066 | 2,904 | → |
| Nakkila | Municipality | 6,248 | 6,396 | 6,094 | 5,788 | 5,256 | 4,939 | → |
| Pomarkku | Municipality | 3,009 | 2,934 | 2,639 | 2,460 | 2,063 | 1,931 | → |
| Pori (incl. Lavia) | Municipality | 87,977 | 85,348 | 84,573 | 85,026 | 83,684 | 83,305 | → |
| Rauma | Municipality | 42,973 | 42,410 | 41,001 | 39,715 | 39,040 | 38,968 | → |
| Säkylä (incl. Köyliö) | Municipality | 8,671 | 8,596 | 8,118 | 7,527 | 6,646 | 6,256 | → |
| Siikainen | Municipality | 2,557 | 2,351 | 1,947 | 1,654 | 1,385 | 1,264 | → |
| Ulvila | Municipality | 12,809 | 14,317 | 14,118 | 13,606 | 12,735 | 12,382 | → |
| Suomi [Finland] | Republic | 4,787,778 | 4,998,478 | 5,181,115 | 5,375,276 | 5,533,793 | 5,635,971 |
Source: Statistics Finland.
Explanation: Regions and municipalities in the boundaries of 1 January 2025.
Further information about the population structure:
| Gender (E 2024) | |
|---|---|
| Males | 104,902 |
| Females | 106,359 |
| Age Groups (E 2024) | |
|---|---|
| 0-17 years | 35,209 |
| 18-64 years | 114,988 |
| 65+ years | 61,064 |
| Age Distribution (E 2024) | |
|---|---|
| 90+ years | 2,898 |
| 80-89 years | 13,709 |
| 70-79 years | 29,759 |
| 60-69 years | 29,624 |
| 50-59 years | 25,880 |
| 40-49 years | 25,716 |
| 30-39 years | 23,920 |
| 20-29 years | 19,865 |
| 10-19 years | 23,034 |
| 0-9 years | 16,856 |
| Citizenship (E 2024) | |
|---|---|
| Finland | 201,011 |
| Europe | 6,877 |
| Other Citizenship | 3,373 |
| Country of Birth (E 2024) | |
|---|---|
| Finland | 198,300 |
| Europe | 8,488 |
| Other Country | 4,473 |
| Language (E 2024) | |
|---|---|
| Finnish | 197,884 |
| Swedish | 804 |
| Sami | 1 |
| Other language | 12,572 |
| Urbanization (E 2023) | |
|---|---|
| Inner urban | 50,910 |
| Outer urban | 49,611 |
| Peri-urban | 42,738 |
| Rural centers | 20,140 |
| Rural near urban areas | 10,236 |
| Rural heartland | 31,215 |
| Sparsely populated | 4,658 |