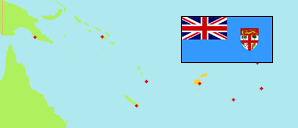
Macuata
Province in Fiji
Contents: Subdivision
The population development in Macuata as well as related information and services (Wikipedia, Google, images).
| Name | Status | Population Census 2007-09-16 | Population Census 2017-09-17 | |
|---|---|---|---|---|
| Macuata | Province | 72,441 | 65,978 | |
| Cikobia | Tikina | 104 | 100 | → |
| Dogotuki | Tikina | 2,115 | 2,092 | → |
| Labasa | Tikina | 54,448 | 49,369 | → |
| Macuata | Tikina | 9,727 | 9,346 | → |
| Sasa | Tikina | 6,047 | 5,071 | → |
| Fiji | Republic | 837,271 | 884,887 |
Source: Fiji Islands Bureau of Statistics (web).
Explanation: The area figures of tikinas are computed by using geospatial data.
Further information about the population structure:
| Gender (C 2017) | |
|---|---|
| Males | 33,182 |
| Females | 32,796 |
| Age Groups (C 2017) | |
|---|---|
| 0-14 years | 18,528 |
| 15-64 years | 43,261 |
| 65+ years | 4,189 |
| Age Distribution (C 2017) | |
|---|---|
| 70+ years | 2,435 |
| 60-69 years | 4,342 |
| 50-59 years | 7,909 |
| 40-49 years | 8,527 |
| 30-39 years | 9,115 |
| 20-29 years | 9,285 |
| 10-19 years | 11,914 |
| 0-9 years | 12,451 |