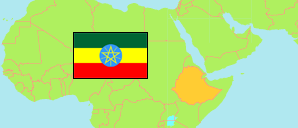
Korem
Town in Ethiopia
Contents: Population
The population development of Korem as well as related information and services (Wikipedia, Google, images).
| Name | Status | Population Census 2007-05-28 | Population Projection 2022-07-01 | |
|---|---|---|---|---|
| Korem | Town | 16,856 | 35,629 | |
| Ethiopia | Federal Democratic Republic | 73,750,932 | 105,163,988 |
Source: Ethiopian Statistics Service (web).
Explanation: The presented division in districts follows the 2007 census atlas and current official projections. The actual number of districts and district-level towns is higher. Also, several boundaries have changed since them.
Further information about the population structure:
| Gender (P 2022) | |
|---|---|
| Males | 16,677 |
| Females | 18,952 |