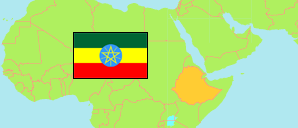
South West
Region in Ethiopia
Contents: Subdivision
The population development in South West as well as related information and services (Wikipedia, Google, images).
| Name | Status | Population Census 2007-05-28 | Population Projection 2022-07-01 | |
|---|---|---|---|---|
| South West | Region | 2,306,984 | 3,302,952 | |
| Anderacha | District | 23,985 | 34,834 | → |
| Bero | District | 12,256 | 18,523 | → |
| Bita | District | 74,577 | 100,830 | → |
| Bonga | Town | 20,858 | 56,045 | → |
| Chena | District | 158,449 | 222,310 | → |
| Cheta | District | 32,619 | 44,479 | → |
| Debub Bench | District | 108,299 | 152,945 | → |
| Decha | District | 128,887 | 175,261 | → |
| Genabosa | District | 86,565 | 114,558 | → |
| Gesha Deka | District | 85,104 | 115,451 | → |
| Gewata | District | 72,473 | 96,270 | → |
| Gimbo | District | 89,892 | 130,328 | → |
| Guraferda | District | 35,271 | 52,791 | → |
| Isara | District | 64,950 | 90,093 | → |
| Konta | District | 90,846 | 129,665 | → |
| Loma | District | 109,192 | 147,556 | → |
| Maji | District | 31,088 | 47,168 | → |
| Mareka | District | 126,022 | 190,009 | → |
| Masha | District | 40,810 | 62,514 | → |
| Meinit Goldeya | District | 88,863 | 119,144 | → |
| Meinit Shasha | District | 43,305 | 60,197 | → |
| Menjiwo | District | 107,731 | 144,128 | → |
| Mizan Aman | Town | 34,080 | 91,437 | → |
| Sayilem | District | 40,874 | 55,991 | → |
| Semen Bench | District | 106,490 | 145,932 | → |
| Shay Bench | District | 118,282 | 160,031 | → |
| Sheko | District | 49,999 | 71,742 | → |
| Surma | District | 24,598 | 33,264 | → |
| Telo | District | 63,252 | 87,160 | → |
| Tocha | District | 102,848 | 142,959 | → |
| Yeki | District | 134,519 | 209,337 | → |
| Ethiopia | Federal Democratic Republic | 73,750,932 | 105,163,988 |
Source: Ethiopian Statistics Service (web).
Explanation: The presented division in districts follows the 2007 census atlas and current official projections. The actual number of districts and district-level towns is higher. Also, several boundaries have changed since them.