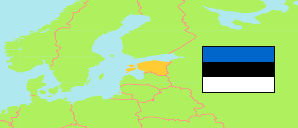
Tallinn (Estonia)
Contents: Built-up Area
The population development of Tallinn as well as related information and services (weather, Wikipedia, Google, images).
| Name | County | Population Census 2011-12-31 | Population Census 2021-12-31 | |
|---|---|---|---|---|
| Tallinn (incl. Harkujärve, Tiskre) | Harju | 392,956 | 439,632 | → |
Source: Statistical Office of Estonia (web).
Explanation: Settlements are defined by built-up areas where the distance between buildings is no more than 200 meters and where live at least 200 persons. Area figures and boundary refer to the 2011 definition.
Further information about the population structure:
| Gender (C 2021) | |
|---|---|
| Males | 206,127 |
| Females | 233,505 |
| Age Groups (C 2021) | |
|---|---|
| 0-17 years | 83,269 |
| 18-64 years | 274,008 |
| 65+ years | 82,355 |
| Age Distribution (C 2021) | |
|---|---|
| 80+ years | 24,531 |
| 70-79 years | 33,848 |
| 60-69 years | 49,280 |
| 50-59 years | 51,266 |
| 40-49 years | 64,852 |
| 30-39 years | 79,067 |
| 20-29 years | 46,430 |
| 10-19 years | 43,466 |
| 0-9 years | 46,892 |