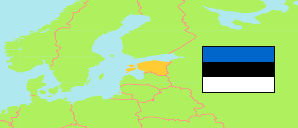
Ida-Viru
County in Estonia
Contents: Subdivision
The population development in Ida-Viru as well as related information and services (Wikipedia, Google, images).
| Name | Status | Population Census 2000-03-31 | Population Census 2011-12-31 | Population Census 2021-12-31 | Population Estimate 2025-01-01 | |
|---|---|---|---|---|---|---|
| Ida-Viru | County | 174,819 | 145,373 | 132,741 | 130,156 | |
| Alutaguse | Rural Municipality | 5,288 | 4,284 | 4,167 | 4,014 | → |
| Jõhvi | Rural Municipality | 13,876 | 12,738 | 11,948 | 12,182 | → |
| Kohtla-Järve linn | Urban Municipality | 46,973 | 37,103 | 33,499 | 32,839 | → |
| Lüganuse | Rural Municipality | 12,504 | 9,566 | 8,223 | 8,042 | → |
| Narva-Jõesuu linn | Urban Municipality | 5,289 | 4,160 | 4,175 | 4,239 | → |
| Narva linn | Urban Municipality | 68,665 | 58,663 | 53,955 | 52,495 | → |
| Sillamäe linn | Urban Municipality | 17,200 | 14,252 | 12,439 | 12,153 | → |
| Toila | Rural Municipality | 5,024 | 4,607 | 4,335 | 4,192 | → |
| Eesti [Estonia] | Republic | 1,370,052 | 1,294,455 | 1,331,824 | 1,369,995 |
Source: Statistical Office of Estonia.
Explanation: Counties and municipalities after the administrative reform of 2017.
Further information about the population structure:
| Gender (E 2025) | |
|---|---|
| Males | 59,918 |
| Females | 70,238 |
| Age Groups (E 2025) | |
|---|---|
| 0-17 years | 19,893 |
| 18-64 years | 72,945 |
| 65+ years | 37,318 |
| Age Distribution (E 2025) | |
|---|---|
| 90+ years | 1,569 |
| 80-89 years | 7,327 |
| 70-79 years | 16,901 |
| 60-69 years | 22,262 |
| 50-59 years | 18,227 |
| 40-49 years | 16,681 |
| 30-39 years | 13,480 |
| 20-29 years | 11,001 |
| 10-19 years | 13,184 |
| 0-9 years | 9,524 |
| Citizenship (E 2025) | |
|---|---|
| Estonia | 73,147 |
| European Union | 1,377 |
| Russia | 33,256 |
| Ukraine | 4,742 |
| Other Citizenship | 753 |
| Country of Birth (C 2021) | |
|---|---|
| Estonia | 89,421 |
| Russia | 33,686 |
| Other Country | 9,619 |
| First Language (C 2021) | |
|---|---|
| Estonian | 19,276 |
| Russian | 110,255 |
| Other Language | 2,949 |
| Ethnic Group (C 2021) | |
|---|---|
| Estonians | 24,490 |
| Russians | 97,231 |
| Other Ethnic Group | 10,829 |
| Religion (C 2021) | |
|---|---|
| Lutherans | 2,440 |
| Orthodox | 53,180 |
| Other Religion | 4,380 |
| No Religion | 40,250 |