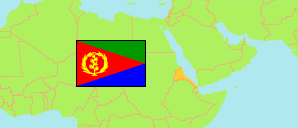
The reliability of all population figures for Eritrea is low.
Regions
Population figures for the regions (zobas) of Eritrea.
| Name | Abbr. | Capital | Area A (km²) | Population Census (C) 1984-05-09 | Population Estimate (E) 2001-07-01 | Population Projection (P) 2012-07-01 | |||
|---|---|---|---|---|---|---|---|---|---|
| Eritrea | ERI | Āsmera | 121,100 | 2,748,304 | 3,194,800 | 3,815,900 | |||
| Ānseba | AN | Keren | 23,200 | ... | 484,200 | 568,200 | 2320000 | ||
| Debub [Southern] | DU | Ādī Ugrī | 8,000 | ... | 839,700 | 991,800 | 800000 | ||
| Debubawī K'eyih Bahrī [Southern Red Sea] | DK | Āseb | 27,600 | ... | 73,700 | 93,800 | 2760000 | ||
| Gash Barka | GB | Āk'ordat | 33,200 | ... | 625,100 | 770,700 | 3320000 | ||
| Ma'ākel (Ma'ekel) [Central] | MA | Āsmera | 1,300 | ... | 595,900 | 761,000 | 130000 | ||
| Semēnawi K'eyih Bahrī [Northern Red Sea] | SK | Mits'iwa | 27,800 | ... | 576,200 | 630,400 | 2780000 |
- (2001) Eritrea Ministry of Local Government (via GeoHive); other sources provide different figures for the same estimate.
(2012) Eritrea Ministry of Health. The projection is based on the 2001 estimates. The population of Northern Red Sea region is adjusted by about 90,000 to complement the total population.
Major Cities
| Name | Adm. | Population Estimate (E) 2018-07-01 | |
|---|---|---|---|
| 1 | Āsmera | MA | 896,000 |
Contents: Cities & Urban Centers
Population figures for cities and urban centers in Eritrea.
| Name | Adm. | Population Census (C) 1984-05-09 | Population Estimate (E) 1997-07-01 | Area | |
|---|---|---|---|---|---|
| Ādī K'eyih (Adi Qayeh) | DU | 8,691 | 15,633 | 0 | |
| Ādī Kwala (Adi Qala) | DU | 4,465 | 7,225 | 0 | |
| Ādī Tekelezan | AN | ... | 9,616 | 0 | |
| Ādī Ugrī (Mendefera) | DU | 12,184 | 20,391 | 0 | |
| Āfabēt | SK | ... | 35,673 | 0 | |
| Āk'ordat (Agordat) | GB | 5,948 | 22,316 | 0 | |
| Āreza | DU | ... | 4,774 | 0 | |
| Āseb (Assab) | DK | 31,037 | 44,220 | 0 | |
| Āsmera (Asmara) | MA | 275,385 | 380,568 | 0 | |
| Barentu | GB | 2,500 | 13,219 | 0 | |
| Debarwa | DU | ... | 3,435 | 0 | |
| Dek'emhāre | DU | 7,290 | 21,675 | 0 | |
| Gīnda (Ghinda) | SK | 7,702 | 15,539 | 0 | |
| Guluy (Golluj) | GB | ... | 9,297 | 0 | |
| Hageza (Hagaz) | AN | ... | 11,861 | 0 | |
| Haykota | GB | ... | 2,587 | 0 | |
| Keren | AN | 26,149 | 55,586 | 0 | |
| Mits'iwa (Massawa) | SK | 15,441 | 27,179 | 0 | |
| Nak'fa (Nacfa) | SK | ... | 4,312 | 0 | |
| Om Hājer (Umhajer) | GB | ... | 9,240 | 0 | |
| Segeneytī (Segeneiti) | DU | 3,328 | 6,146 | 0 | |
| Sen'afē | DU | 4,019 | 12,282 | 0 | |
| Teseney (Tessenei) | GB | 2,531 | 15,327 | 0 | |
| Tserona | DU | ... | 3,557 | 0 |
- (1997) (www.awate.com). These population figures may underestimate the population. The exact reference date is uncertain.
(2018) UN World Urbanization Prospects: The 2018 Revision.
