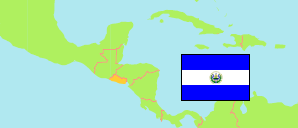
San Salvador Sur
Municipality in El Salvador
Contents: Population
The population development of San Salvador Sur as well as related information and services (Wikipedia, Google, images).
| Name | Status | Population Census 1992-09-27 | Population Census 2007-05-12 | Population Census 2024-05-02 | |
|---|---|---|---|---|---|
| San Salvador Sur | Municipality | 139,364 | 160,618 | 166,671 | |
| El Salvador | Republic | 5,118,599 | 5,744,113 | 6,029,976 |
Source: Oficina Nacional de Estadística y Censos; Banco Central de Reserva de El Salvador.
Explanation: The presented municipal division came into effect in May 2024. Census figures are not adjusted for underenumeration.
Further information about the population structure:
| Gender (C 2024) | |
|---|---|
| Males | 78,136 |
| Females | 88,535 |
| Age Groups (C 2024) | |
|---|---|
| 0-14 years | 35,657 |
| 15-64 years | 115,198 |
| 65+ years | 15,816 |
| Age Distribution (C 2024) | |
|---|---|
| 90+ years | 766 |
| 80-89 years | 3,202 |
| 70-79 years | 6,864 |
| 60-69 years | 11,945 |
| 50-59 years | 17,757 |
| 40-49 years | 21,953 |
| 30-39 years | 25,872 |
| 20-29 years | 29,636 |
| 10-19 years | 25,873 |
| 0-9 years | 22,803 |
| Urbanization (C 2024) | |
|---|---|
| Rural | 12,458 |
| Urban | 154,213 |
