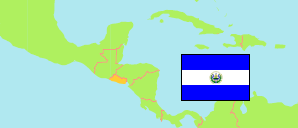
La Libertad
Department in El Salvador
Contents: Subdivision
The population development in La Libertad as well as related information and services (Wikipedia, Google, images).
| Name | Status | Population Census 1992-09-27 | Population Projection 2007-06-30 | Population Projection 2020-06-30 | |
|---|---|---|---|---|---|
| La Libertad | Department | 513,866 | 711,196 | 830,976 | |
| Antiguo Cuscatlán | Municipality | 28,187 | 36,276 | 47,956 | → |
| Chiltiupán | Municipality | 10,988 | 11,731 | 11,656 | → |
| Ciudad Arce | Municipality | 39,796 | 64,928 | 76,347 | → |
| Colón | Municipality | 49,570 | 104,409 | 151,449 | → |
| Comasagua | Municipality | 10,871 | 12,778 | 12,030 | → |
| Huizúcar | Municipality | 9,205 | 15,572 | 17,289 | → |
| Jayaque | Municipality | 11,401 | 11,904 | 11,596 | → |
| Jicalapa | Municipality | 5,523 | 5,507 | 5,921 | → |
| La Libertad | Municipality | 33,590 | 38,751 | 41,321 | → |
| Nuevo Cuscatlán | Municipality | 5,119 | 7,425 | 9,442 | → |
| Quezaltepeque | Municipality | 46,693 | 56,670 | 58,009 | → |
| Sacacoyo | Municipality | 9,183 | 13,240 | 16,265 | → |
| San José Villanueva | Municipality | 7,247 | 14,615 | 20,353 | → |
| San Juan Opico (Opico) | Municipality | 51,701 | 79,963 | 90,088 | → |
| San Matías | Municipality | 7,358 | 7,874 | 7,727 | → |
| San Pablo Tacachico | Municipality | 18,707 | 21,924 | 21,856 | → |
| Santa Tecla | Municipality | 113,698 | 131,235 | 139,908 | → |
| Talnique | Municipality | 6,193 | 8,885 | 9,709 | → |
| Tamanique | Municipality | 11,387 | 14,580 | 16,179 | → |
| Teotepeque | Municipality | 12,177 | 13,263 | 12,810 | → |
| Tepecoyo | Municipality | 10,838 | 15,418 | 15,979 | → |
| Zaragoza | Municipality | 14,434 | 24,248 | 37,086 | → |
| El Salvador | Republic | 5,118,599 | 6,097,389 | 6,765,753 |
Source: Dirección General de Estadistica y Censos (web).
Explanation: In contrast to the projection, the census figures are not adjusted for underenumeration.