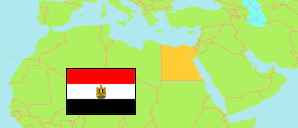
Biyalā
Markaz in Egypt
Contents: Population
The population development of Biyalā as well as related information and services (Wikipedia, Google, images).
| Name | Status | Native | Population Census 1996-11-19 | Population Census 2006-11-11 | Population Census 2017-03-28 | Population Estimate 2023-07-01 | |
|---|---|---|---|---|---|---|---|
| Biyalā | Markaz | مركز بيلا | 147,474 | 167,115 | 216,484 | 238,418 | |
| Miṣr [Egypt] | Republic | مِصر | 59,276,672 | 72,798,031 | 94,798,827 | 105,174,090 |
Source: Central Agency for Public Mobilization and Statistics (CAPMAS), Egypt.
Explanation: Some figures for 2006 are computed using preliminary census results. Area figures of districts are derived from geospatial data.
Further information about the population structure:
| Gender (E 2023) | |
|---|---|
| Males | 119,273 |
| Females | 119,145 |
| Age Groups (C 2017) | |
|---|---|
| 0-14 years | 71,216 |
| 15-64 years | 135,323 |
| 65+ years | 9,945 |
| Age Distribution (C 2017) | |
|---|---|
| 90+ years | 171 |
| 80-89 years | 1,161 |
| 70-79 years | 4,021 |
| 60-69 years | 11,713 |
| 50-59 years | 19,018 |
| 40-49 years | 23,126 |
| 30-39 years | 30,364 |
| 20-29 years | 35,892 |
| 10-19 years | 39,656 |
| 0-9 years | 51,362 |
| Urbanization (E 2023) | |
|---|---|
| Rural | 238,418 |
