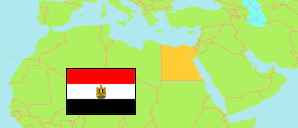
Shibīn al-Kawm
Kism (fully urban) in Egypt
Contents: Population
The population development of Shibīn al-Kawm as well as related information and services (Wikipedia, Google, images).
| Name | Status | Native | Population Census 1996-11-19 | Population Census 2006-11-11 | Population Census 2017-03-28 | Population Estimate 2023-07-01 | |
|---|---|---|---|---|---|---|---|
| Shibīn al-Kawm [Shibin el-Kom] | Kism (fully urban) | قسم شبين الكوم | 156,794 | 177,112 | 239,624 | 277,991 | |
| Miṣr [Egypt] | Republic | مِصر | 59,276,672 | 72,798,031 | 94,798,827 | 105,174,090 |
Source: Central Agency for Public Mobilization and Statistics (CAPMAS), Egypt.
Explanation: Some figures for 2006 are computed using preliminary census results. Area figures of districts are derived from geospatial data.
Further information about the population structure:
| Gender (E 2023) | |
|---|---|
| Males | 139,777 |
| Females | 138,214 |
| Age Groups (C 2017) | |
|---|---|
| 0-14 years | 69,891 |
| 15-64 years | 158,899 |
| 65+ years | 10,834 |
| Age Distribution (C 2017) | |
|---|---|
| 90+ years | 176 |
| 80-89 years | 968 |
| 70-79 years | 4,230 |
| 60-69 years | 13,987 |
| 50-59 years | 21,850 |
| 40-49 years | 25,327 |
| 30-39 years | 35,121 |
| 20-29 years | 45,887 |
| 10-19 years | 42,842 |
| 0-9 years | 49,236 |
| Urbanization (E 2023) | |
|---|---|
| Urban | 277,991 |
