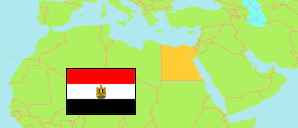
Sīnā' al-Janūbiyah
Governorate in Egypt
Contents: Subdivision
The population development in Sīnā' al-Janūbiyah as well as related information and services (Wikipedia, Google, images).
| Name | Status | Native | Population Census 1996-11-19 | Population Census 2006-11-11 | Population Census 2017-03-28 | Population Estimate 2023-07-01 | |
|---|---|---|---|---|---|---|---|
| Sīnā' al-Janūbiyah [South Sinai] | Governorate | جنوب سيناء | 54,806 | 150,088 | 102,018 | 116,479 | |
| Abū Radīs [incl. Abū Zanīmah] | Kism (urban and rural parts) | قسم أبو رديس | 13,040 | 17,813 | 16,653 | 20,661 | → |
| Aṭ-Ṭūr [El Tor] | Kism (urban and rural parts) | قسم الطور | 14,142 | 26,590 | 38,867 | 45,989 | → |
| Dahab | Kism (urban and rural parts) | قسم دهب | 3,700 | 7,494 | 2,934 | 3,169 | → |
| Nuwaybi'a | Kism (urban and rural parts) | قسم نويبع | ... | 7,970 | 7,255 | 7,737 | → |
| Ras Sidr | Kism (urban and rural parts) | قسم رأس سدر | 6,584 | 12,062 | 16,410 | 18,036 | → |
| Sānt Kātirīn [Saint Catherine] | Kism (urban and rural parts) | قسم سانت كاترين | 4,219 | 5,705 | 4,542 | 4,881 | → |
| Sharm ash-Shaykh 1 [Sharm el-Sheikh] | Kism (fully urban) | قسم أول شرم الشيخ | 7,410 | 69,374 | 13,201 | 13,616 | → |
| Sharm ash-Shaykh 2 [Sharm el-Sheikh] | Kism (urban and rural parts) | قسم ثان شرم الشيخ | ... | ... | 1,441 | 1,569 | → |
| Shurṭah Ṭābā [Taba] | Kism (fully rural) | قسم شرطة طابا | ... | 3,080 | 715 | 821 | → |
| Miṣr [Egypt] | Republic | مِصر | 59,276,672 | 72,798,031 | 94,798,827 | 105,174,090 |
Source: Central Agency for Public Mobilization and Statistics (CAPMAS), Egypt.
Explanation: Some figures for 2006 are computed using preliminary census results. Area figures of districts are derived from geospatial data.
Further information about the population structure:
| Gender (E 2023) | |
|---|---|
| Males | 59,502 |
| Females | 56,977 |
| Age Groups (C 2017) | |
|---|---|
| 0-14 years | 40,141 |
| 15-64 years | 60,149 |
| 65+ years | 1,728 |
| Age Distribution (C 2017) | |
|---|---|
| 90+ years | 20 |
| 80-89 years | 169 |
| 70-79 years | 634 |
| 60-69 years | 2,633 |
| 50-59 years | 6,331 |
| 40-49 years | 10,765 |
| 30-39 years | 16,620 |
| 20-29 years | 15,339 |
| 10-19 years | 20,810 |
| 0-9 years | 28,697 |
| Urbanization (E 2023) | |
|---|---|
| Rural | 51,384 |
| Urban | 65,095 |