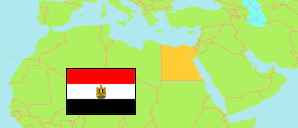
Maṭrūḥ
Governorate in Egypt
Contents: Subdivision
The population development in Maṭrūḥ as well as related information and services (Wikipedia, Google, images).
| Name | Status | Native | Population Census 1996-11-19 | Population Census 2006-11-11 | Population Census 2017-03-28 | Population Estimate 2023-07-01 | |
|---|---|---|---|---|---|---|---|
| Maṭrūḥ [Matrouh] | Governorate | مطروخ | 212,001 | 323,381 | 425,624 | 547,702 | |
| Aḍ-Ḍab'ah | Kism (urban and rural parts) | قسم الضبعة | 38,579 | 39,178 | 49,399 | 62,207 | → |
| Al-'Alamayn | Kism (fully rural) | قسم العلمين | ... | 52 | 9,932 | 12,580 | → |
| Al-Ḥammām | Kism (urban and rural parts) | قسم الحمام | 39,326 | 56,401 | 54,010 | 66,448 | → |
| An-Najīlah | Kism (urban and rural parts) | قسم النجيله | 11,016 | 18,338 | 27,456 | 35,155 | → |
| As-Sāḥal ash-Shamāli | Kism (fully urban) | قسم الساحل الشمالى-جزء | ... | 536 | 67 | 89 | → |
| As-Sallūm | Kism (urban and rural parts) | قسم السلوم | 9,052 | 12,750 | 15,808 | 20,911 | → |
| Marsā Maṭrūḥ [Mersa Matruh] | Kism (urban and rural parts) | قسم مرسى مطروح | 80,387 | 140,977 | 188,252 | 246,333 | → |
| Sīdī Barrānī | Kism (urban and rural parts) | قسم سيدى برانى | 20,689 | 33,456 | 52,612 | 67,405 | → |
| Sīwa | Kism (urban and rural parts) | قسم سيوة | 12,952 | 21,693 | 28,088 | 36,574 | → |
| Miṣr [Egypt] | Republic | مِصر | 59,276,672 | 72,798,031 | 94,798,827 | 105,174,090 |
Source: Central Agency for Public Mobilization and Statistics (CAPMAS), Egypt.
Explanation: Some figures for 2006 are computed using preliminary census results. Area figures of districts are derived from geospatial data.
Further information about the population structure:
| Gender (E 2023) | |
|---|---|
| Males | 284,574 |
| Females | 263,128 |
| Age Groups (C 2017) | |
|---|---|
| 0-14 years | 175,506 |
| 15-64 years | 241,953 |
| 65+ years | 8,165 |
| Age Distribution (C 2017) | |
|---|---|
| 90+ years | 210 |
| 80-89 years | 842 |
| 70-79 years | 3,099 |
| 60-69 years | 11,012 |
| 50-59 years | 22,560 |
| 40-49 years | 38,726 |
| 30-39 years | 60,493 |
| 20-29 years | 74,357 |
| 10-19 years | 83,856 |
| 0-9 years | 130,469 |
| Urbanization (E 2023) | |
|---|---|
| Rural | 188,026 |
| Urban | 359,676 |
