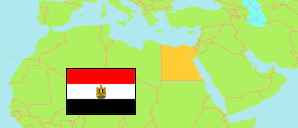
Al-Baḥr al-Aḥmar
Governorate in Egypt
Contents: Subdivision
The population development in Al-Baḥr al-Aḥmar as well as related information and services (Wikipedia, Google, images).
| Name | Status | Native | Population Census 1996-11-19 | Population Census 2006-11-11 | Population Census 2017-03-28 | Population Estimate 2023-07-01 | |
|---|---|---|---|---|---|---|---|
| Al-Baḥr al-Aḥmar [Red Sea] | Governorate | البحر الأحمر | 157,314 | 288,661 | 359,888 | 403,077 | |
| Al-Ghurdaqah 1 [Hurghada] | Kism (fully urban) | قسم أول الغردقة | ... | 69,616 | 75,239 | 84,534 | → |
| Al-Ghurdaqah 2 [Hurghada] | Kism (fully urban) | قسم ثان الغردقة | ... | 91,285 | 115,393 | 129,713 | → |
| Al-Quṣayr | Kism (urban and rural parts) | قسم القصير | 27,618 | 35,920 | 47,817 | 53,637 | → |
| Ash-Shalātīn | Kism (urban and rural parts) | قسم الشلاتين | 9,417 | 15,210 | 12,433 | 13,860 | → |
| Ḥalāyib | Kism (fully rural) | قسم حلايب | 1,665 | 2,268 | 7,920 | 8,339 | → |
| Marsā 'Alam | Kism (urban and rural parts) | قسم مرسى علم | 3,382 | 6,614 | 8,553 | 9,190 | → |
| Ras Ghārib [Ras Gharib] | Kism (urban and rural parts) | قسم رأس غارب | 28,435 | 32,369 | 41,526 | 46,654 | → |
| Safājā [Safaga] | Kism (urban and rural parts) | قسم سفاجا | 26,712 | 35,379 | 51,007 | 57,150 | → |
| Miṣr [Egypt] | Republic | مِصر | 59,276,672 | 72,798,031 | 94,798,827 | 105,174,090 |
Source: Central Agency for Public Mobilization and Statistics (CAPMAS), Egypt.
Explanation: Some figures for 2006 are computed using preliminary census results. Area figures of districts are derived from geospatial data.
Further information about the population structure:
| Gender (E 2023) | |
|---|---|
| Males | 208,653 |
| Females | 194,424 |
| Age Groups (C 2017) | |
|---|---|
| 0-14 years | 130,193 |
| 15-64 years | 219,978 |
| 65+ years | 9,717 |
| Age Distribution (C 2017) | |
|---|---|
| 90+ years | 300 |
| 80-89 years | 1,060 |
| 70-79 years | 3,808 |
| 60-69 years | 11,634 |
| 50-59 years | 22,132 |
| 40-49 years | 37,599 |
| 30-39 years | 64,153 |
| 20-29 years | 59,136 |
| 10-19 years | 65,147 |
| 0-9 years | 94,919 |
| Urbanization (E 2023) | |
|---|---|
| Rural | 12,621 |
| Urban | 390,456 |
