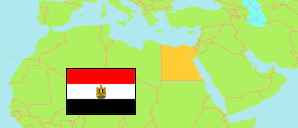
Al-Uqṣor
Governorate in Egypt
Contents: Subdivision
The population development in Al-Uqṣor as well as related information and services (Wikipedia, Google, images).
| Name | Status | Native | Population Census 1996-11-19 | Population Census 2006-11-11 | Population Census 2017-03-28 | Population Estimate 2023-07-01 | |
|---|---|---|---|---|---|---|---|
| Al-Uqṣor [Luxor] | Governorate | الأقصر | 775,551 | 959,003 | 1,250,209 | 1,400,640 | |
| Al-Qarnah | Markaz | مركز القرنه | ... | 130,146 | 164,375 | 181,237 | → |
| Al-Uqṣur [Luxor] | Kism (fully urban) | قسم الأقصر | ... | 167,646 | 242,375 | 284,952 | → |
| Al-Uqṣur [Luxor] | Markaz | مركز الأقصر | ... | 116,974 | 165,248 | 183,485 | → |
| Armant | Markaz | مركز أرمنت | ... | 159,809 | 174,010 | 195,011 | → |
| Isnā [Esna] | Markaz | مركز إسنا | 279,835 | 341,908 | 431,242 | 475,034 | → |
| Shurṭah Ṭībah [Tiba] | Markaz | مركز شرطة طيبة | ... | 56,196 | 72,959 | 80,921 | → |
| Miṣr [Egypt] | Republic | مِصر | 59,276,672 | 72,798,031 | 94,798,827 | 105,174,090 |
Source: Central Agency for Public Mobilization and Statistics (CAPMAS), Egypt.
Explanation: Some figures for 2006 are computed using preliminary census results. Area figures of districts are derived from geospatial data.
Further information about the population structure:
| Gender (E 2023) | |
|---|---|
| Males | 720,900 |
| Females | 679,740 |
| Age Groups (C 2017) | |
|---|---|
| 0-14 years | 397,793 |
| 15-64 years | 795,607 |
| 65+ years | 56,809 |
| Age Distribution (C 2017) | |
|---|---|
| 90+ years | 1,447 |
| 80-89 years | 8,658 |
| 70-79 years | 22,830 |
| 60-69 years | 59,782 |
| 50-59 years | 96,999 |
| 40-49 years | 121,968 |
| 30-39 years | 182,084 |
| 20-29 years | 237,577 |
| 10-19 years | 228,809 |
| 0-9 years | 290,055 |
| Urbanization (E 2023) | |
|---|---|
| Rural | 806,282 |
| Urban | 594,358 |
