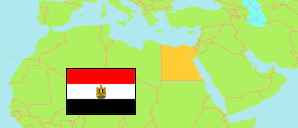
Aswān
Governorate in Egypt
Contents: Subdivision
The population development in Aswān as well as related information and services (Wikipedia, Google, images).
| Name | Status | Native | Population Census 1996-11-19 | Population Census 2006-11-11 | Population Census 2017-03-28 | Population Estimate 2023-07-01 | |
|---|---|---|---|---|---|---|---|
| Aswān [Assuan] | Governorate | أسوان | 960,510 | 1,186,482 | 1,473,975 | 1,656,218 | |
| Abū Sunbul [Abu Simbel] | Markaz | مركز أبو سنبل | ... | 6,413 | 7,617 | 8,378 | → |
| Aswān | Markaz | مركز أسوان | 61,575 | 70,541 | 71,490 | 73,715 | → |
| Aswān 1 | Kism (fully urban) | قسم اول أسوان | ... | ... | 151,993 | 190,979 | → |
| Aswān 2 | Kism (fully urban) | قسم ثان أسوان | ... | ... | 167,862 | 210,911 | → |
| Daraw | Markaz | مركز دراو | 83,028 | 98,036 | 136,561 | 152,541 | → |
| Idfū [Edfu] | Markaz | مركز أدفو | 298,826 | 365,353 | 460,160 | 502,994 | → |
| Kawm Umbū [Kom Ombo] | Markaz | مركز كوم امبو | 230,472 | 300,935 | 386,686 | 420,790 | → |
| Madīnat Aswān al-Jadīdah [New Aswan] | New City | مدينة أسوان الجديدة | 0 | 0 | 95 | 120 | → |
| Madīnat Tūshka al-Jadīdah [New Tushka] | New City | مدينة توشكى الجديدة | ... | 2,655 | ... | ... | → |
| Naṣr [Nasser City] | Markaz | مركز نصر | 67,068 | 76,536 | 91,511 | 95,790 | → |
| Miṣr [Egypt] | Republic | مِصر | 59,276,672 | 72,798,031 | 94,798,827 | 105,174,090 |
Source: Central Agency for Public Mobilization and Statistics (CAPMAS), Egypt.
Explanation: Some figures for 2006 are computed using preliminary census results. Area figures of districts are derived from geospatial data.
Further information about the population structure:
| Gender (E 2023) | |
|---|---|
| Males | 840,398 |
| Females | 815,820 |
| Age Groups (C 2017) | |
|---|---|
| 0-14 years | 495,629 |
| 15-64 years | 921,373 |
| 65+ years | 56,973 |
| Age Distribution (C 2017) | |
|---|---|
| 90+ years | 1,276 |
| 80-89 years | 7,765 |
| 70-79 years | 23,659 |
| 60-69 years | 63,585 |
| 50-59 years | 109,889 |
| 40-49 years | 147,322 |
| 30-39 years | 213,751 |
| 20-29 years | 268,598 |
| 10-19 years | 277,408 |
| 0-9 years | 360,722 |
| Urbanization (E 2023) | |
|---|---|
| Rural | 895,856 |
| Urban | 760,362 |
