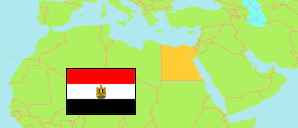
Asyūt
Governorate in Egypt
Contents: Subdivision
The population development in Asyūt as well as related information and services (Wikipedia, Google, images).
| Name | Status | Native | Population Census 1996-11-19 | Population Census 2006-11-11 | Population Census 2017-03-28 | Population Estimate 2023-07-01 | |
|---|---|---|---|---|---|---|---|
| Asyūt [Asyut] | Governorate | أسيوط | 2,802,334 | 3,444,967 | 4,383,289 | 5,061,934 | |
| Abnūb | Markaz | مركز أبنوب | 247,541 | 304,774 | 411,532 | 474,315 | → |
| Abū Tīj | Kism (fully urban) | قسم ابو تيج | 59,474 | 70,969 | 91,417 | 112,077 | → |
| Abū Tīj | Markaz | مركز أبوتيج | 163,448 | 193,118 | 230,501 | 260,459 | → |
| Al-Badārī | Markaz | مركز البدارى | 172,151 | 213,900 | 270,223 | 309,998 | → |
| Al-Fatḥ | Markaz | مركز الفتح | 191,574 | 242,443 | 319,088 | 362,425 | → |
| Al-Ghanāyim [El Ghanayem] | Markaz | مركز الغنايم | 83,206 | 105,079 | 132,674 | 155,815 | → |
| Al-Qūṣiyah | Markaz | مركز القوصية | 289,810 | 360,300 | 463,352 | 531,877 | → |
| Asyūṭ [Asyut] | Markaz | مركز أسيوط | 321,602 | 399,288 | 516,525 | 583,658 | → |
| Asyūṭ 1 [Asyut] | Kism (fully urban) | قسم أول أسيوط | 195,048 | 220,489 | 248,089 | 304,143 | → |
| Asyūṭ 2 [Asyut] | Kism (fully urban) | قسم ثان أسيوط | 148,614 | 168,818 | 210,379 | 257,918 | → |
| Dayrūṭ [Dairut] | Markaz | مركز ديروط | 364,139 | 462,267 | 594,944 | 680,817 | → |
| Madīnat Asyūṭ al-Jadīdah [New Asyut] | New City | مدينة اسيوط الجديدة | ... | 1,761 | 8,003 | 9,810 | → |
| Manfalūṭ | Markaz | مركز منفلوط | 327,159 | 415,405 | 523,613 | 601,482 | → |
| Sāḥīl Salim [Sahel Selim] | Markaz | مركز ساحل سليم | 110,114 | 134,610 | 180,010 | 207,907 | → |
| Ṣidfa [Sodfa] | Markaz | مركز صدفا | 128,454 | 151,746 | 182,939 | 209,233 | → |
| Miṣr [Egypt] | Republic | مِصر | 59,276,672 | 72,798,031 | 94,798,827 | 105,174,090 |
Source: Central Agency for Public Mobilization and Statistics (CAPMAS), Egypt.
Explanation: Some figures for 2006 are computed using preliminary census results. Area figures of districts are derived from geospatial data.
Further information about the population structure:
| Gender (E 2023) | |
|---|---|
| Males | 2,611,574 |
| Females | 2,450,360 |
| Age Groups (C 2017) | |
|---|---|
| 0-14 years | 1,609,887 |
| 15-64 years | 2,614,307 |
| 65+ years | 159,095 |
| Age Distribution (C 2017) | |
|---|---|
| 90+ years | 3,025 |
| 80-89 years | 19,629 |
| 70-79 years | 66,572 |
| 60-69 years | 177,019 |
| 50-59 years | 286,832 |
| 40-49 years | 383,923 |
| 30-39 years | 575,974 |
| 20-29 years | 793,201 |
| 10-19 years | 927,609 |
| 0-9 years | 1,149,505 |
| Urbanization (E 2023) | |
|---|---|
| Rural | 3,670,397 |
| Urban | 1,391,537 |
