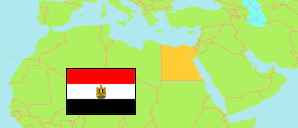
Al-Ismā'īliyah
Governorate in Egypt
Contents: Subdivision
The population development in Al-Ismā'īliyah as well as related information and services (Wikipedia, Google, images).
| Name | Status | Native | Population Census 1996-11-19 | Population Census 2006-11-11 | Population Census 2017-03-28 | Population Estimate 2023-07-01 | |
|---|---|---|---|---|---|---|---|
| Al-Ismā'īliyah [Ismaïlia] | Governorate | الإسماعيلية | 714,828 | 953,006 | 1,303,993 | 1,452,743 | |
| Abū Ṣuwīr | Markaz | مركز ابو صوير | ... | 152,316 | 206,116 | 223,134 | → |
| Al-Ismā'īliyah [Ismaïlia] | Markaz | مركز الاسماعيلية | ... | 97,542 | 159,923 | 170,774 | → |
| Al-Ismā'īliyah 1 [Ismaïlia] | Kism (fully urban) | قسم أول الاسماعيلية | 31,673 | 31,903 | 43,000 | 50,388 | → |
| Al-Ismā'īliyah 2 [Ismaïlia] | Kism (fully urban) | قسم ثان الاسماعيلية | 145,190 | 165,731 | 228,009 | 267,182 | → |
| Al-Ismā'īliyah 3 [Ismaïlia] | Kism (fully urban) | قسم ثالث الاسماعيلية | 78,271 | 95,550 | 113,342 | 132,818 | → |
| Al-Qanṭarah | Markaz | مركز القنطرة | 67,775 | 105,266 | 148,588 | 163,093 | → |
| Al-Qanṭarah Sharq | Kism (urban and rural parts) | قسم القنطرة شرق | 21,558 | 42,197 | 56,294 | 63,073 | → |
| Al-Qaṣāṣīn al-Jadīdah | New City | مركز القصاصين الجديده | ... | 71,513 | 111,618 | 121,455 | → |
| At-Tall al-Kabīr | Markaz | مركز التل الكبير | ... | 66,442 | 101,179 | 112,415 | → |
| Fa'id [Fayid] | Markaz | مركز فايد | 71,106 | 109,815 | 135,924 | 148,411 | → |
| Miṣr [Egypt] | Republic | مِصر | 59,276,672 | 72,798,031 | 94,798,827 | 105,174,090 |
Source: Central Agency for Public Mobilization and Statistics (CAPMAS), Egypt.
Explanation: Some figures for 2006 are computed using preliminary census results. Area figures of districts are derived from geospatial data.
Further information about the population structure:
| Gender (E 2023) | |
|---|---|
| Males | 747,212 |
| Females | 705,531 |
| Age Groups (C 2017) | |
|---|---|
| 0-14 years | 464,966 |
| 15-64 years | 795,857 |
| 65+ years | 43,170 |
| Age Distribution (C 2017) | |
|---|---|
| 90+ years | 663 |
| 80-89 years | 4,270 |
| 70-79 years | 16,869 |
| 60-69 years | 56,598 |
| 50-59 years | 97,420 |
| 40-49 years | 131,199 |
| 30-39 years | 190,869 |
| 20-29 years | 219,804 |
| 10-19 years | 244,315 |
| 0-9 years | 341,986 |
| Urbanization (E 2023) | |
|---|---|
| Rural | 773,156 |
| Urban | 679,587 |