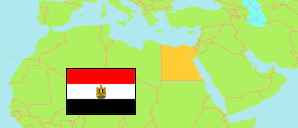
Al-Gharbiyah
Governorate in Egypt
Contents: Subdivision
The population development in Al-Gharbiyah as well as related information and services (Wikipedia, Google, images).
| Name | Status | Native | Population Census 1996-11-19 | Population Census 2006-11-11 | Population Census 2017-03-28 | Population Estimate 2023-07-01 | |
|---|---|---|---|---|---|---|---|
| Al-Gharbiyah [Gharbia] | Governorate | الغربية | 3,404,339 | 4,011,320 | 4,999,633 | 5,439,085 | |
| Al-Maḥallah al-Kubrā | Markaz | مركز المحله الكبرى | 477,872 | 589,540 | 793,686 | 833,663 | → |
| Al-Maḥallah al-Kubrā 1 [Mahalla el-Kubra] | Kism (fully urban) | قسم أول المحلة الكبرى | ... | 139,182 | 158,876 | 188,091 | → |
| Al-Maḥallah al-Kubrā 2 [Mahalla el-Kubra] | Kism (fully urban) | قسم ثان المحلة الكبرى | ... | 206,258 | 246,250 | 291,539 | → |
| Al-Maḥallah al-Kubrā 3 [Mahalla el-Kubra] | Kism (fully urban) | قسم ثالث المحلة الكبرى | ... | 96,305 | 113,672 | 134,572 | → |
| As-Sanṭah | Markaz | مركز السنطة | 313,286 | 371,494 | 480,888 | 510,467 | → |
| Basyūn [Basyoun] | Markaz | مركز بسيون | 212,896 | 243,141 | 296,355 | 320,056 | → |
| Kafr az-Zayyāt | Markaz | مركز كفر الزيات | 323,927 | 379,219 | 455,856 | 488,561 | → |
| Quṭūr | Markaz | مركز قطور | 245,775 | 279,516 | 338,626 | 359,424 | → |
| Samannūd | Markaz | مركز سمنود | 249,672 | 298,166 | 398,157 | 428,490 | → |
| Ṭanṭā | Markaz | مركز طنطا | 446,638 | 538,575 | 685,038 | 719,542 | → |
| Ṭanṭā 1 | Kism (fully urban) | قسم أول طنطا | 193,666 | 208,579 | 268,529 | 317,914 | → |
| Ṭanṭā 2 | Kism (fully urban) | قسم ثان طنطا | 179,226 | 214,275 | 236,326 | 279,780 | → |
| Ziftā [Zefta] | Markaz | مركز زفتى | 285,593 | 352,117 | 429,577 | 451,212 | → |
| Ziftā | Kism (fully urban) | قسم زفتى | 80,864 | 93,740 | 97,797 | 115,774 | → |
| Miṣr [Egypt] | Republic | مِصر | 59,276,672 | 72,798,031 | 94,798,827 | 105,174,090 |
Source: Central Agency for Public Mobilization and Statistics (CAPMAS), Egypt.
Explanation: Some figures for 2006 are computed using preliminary census results. Area figures of districts are derived from geospatial data.
Further information about the population structure:
| Gender (E 2023) | |
|---|---|
| Males | 2,776,452 |
| Females | 2,662,633 |
| Age Groups (C 2017) | |
|---|---|
| 0-14 years | 1,621,447 |
| 15-64 years | 3,160,349 |
| 65+ years | 217,837 |
| Age Distribution (C 2017) | |
|---|---|
| 90+ years | 3,240 |
| 80-89 years | 21,522 |
| 70-79 years | 87,910 |
| 60-69 years | 268,974 |
| 50-59 years | 437,950 |
| 40-49 years | 531,915 |
| 30-39 years | 749,630 |
| 20-29 years | 831,917 |
| 10-19 years | 909,573 |
| 0-9 years | 1,157,002 |
| Urbanization (E 2023) | |
|---|---|
| Rural | 3,775,374 |
| Urban | 1,663,711 |