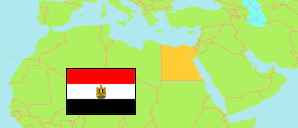
Al-Qalyūbyah
Governorate in Egypt
Contents: Subdivision
The population development in Al-Qalyūbyah as well as related information and services (Wikipedia, Google, images).
| Name | Status | Native | Population Census 1996-11-19 | Population Census 2006-11-11 | Population Census 2017-03-28 | Population Estimate 2023-07-01 | |
|---|---|---|---|---|---|---|---|
| Al-Qalyūbyah [Qalyubia] | Governorate | القليوبية | 3,281,135 | 4,251,672 | 5,627,420 | 6,137,688 | |
| Al-Khānkah | Kism (fully urban) | قسم الخانكه | 55,013 | 59,077 | 76,455 | 83,981 | → |
| Al-Khānkah | Markaz | مركز الخانكة | ... | 377,014 | 572,584 | 621,221 | → |
| Al-Khuṣūṣ | Kism (fully urban) | قسم الخصوص | ... | 291,242 | 457,852 | 502,864 | → |
| Al-Qanāṭir al-Khayriyah | Markaz | مركز القناطر الخيرية | 296,731 | 383,102 | 505,401 | 549,392 | → |
| Al-'Ubūr [El Ubour] | Kism (fully urban) | قسم العبور | ... | 43,600 | 130,161 | 142,955 | → |
| Banhā | Markaz | مركز بنها | 308,833 | 376,175 | 481,287 | 522,189 | → |
| Banhā 1 | Kism (fully urban) | قسم اول بنها | ... | ... | 106,409 | 116,894 | → |
| Banhā 2 | Kism (fully urban) | قسم ثان بنها | ... | ... | 64,247 | 70,575 | → |
| Kafr Shukr | Markaz | مركز كفر شكر | 123,013 | 148,351 | 188,193 | 204,576 | → |
| Qahā | Kism (urban and rural parts) | قسم قها | ... | 35,655 | 47,723 | 52,237 | → |
| Qalyūb | Kism (fully urban) | قسم قليوب | 77,081 | 107,303 | 146,430 | 160,831 | → |
| Qalyūb | Markaz | مركز قليوب | 264,375 | 365,892 | 559,315 | 606,830 | → |
| Shubrā al-Khaymah 1 [Shubra el-Kheima] | Kism (fully urban) | قسم أول شبرا الخيمة | 416,812 | 461,689 | 481,936 | 529,337 | → |
| Shubrā al-Khaymah 2 [Shubra el-Kheima] | Kism (fully urban) | قسم ثان شبرا الخيمة | 453,963 | 563,880 | 679,578 | 746,363 | → |
| Sibīn al-Qanāṭir [Shibin el-Qanater] | Markaz | مركز شبين القناطر | 338,628 | 423,783 | 538,224 | 584,885 | → |
| Ṭūkh | Markaz | مركز طوخ | ... | 457,208 | 591,625 | 642,558 | → |
| Miṣr [Egypt] | Republic | مِصر | 59,276,672 | 72,798,031 | 94,798,827 | 105,174,090 |
Source: Central Agency for Public Mobilization and Statistics (CAPMAS), Egypt.
Explanation: Some figures for 2006 are computed using preliminary census results. Area figures of districts are derived from geospatial data.
Further information about the population structure:
| Gender (E 2023) | |
|---|---|
| Males | 3,161,219 |
| Females | 2,976,469 |
| Age Groups (C 2017) | |
|---|---|
| 0-14 years | 1,933,554 |
| 15-64 years | 3,521,428 |
| 65+ years | 172,438 |
| Age Distribution (C 2017) | |
|---|---|
| 90+ years | 2,480 |
| 80-89 years | 16,700 |
| 70-79 years | 68,445 |
| 60-69 years | 224,946 |
| 50-59 years | 413,074 |
| 40-49 years | 608,102 |
| 30-39 years | 907,118 |
| 20-29 years | 921,175 |
| 10-19 years | 1,091,193 |
| 0-9 years | 1,374,187 |
| Urbanization (E 2023) | |
|---|---|
| Rural | 3,498,919 |
| Urban | 2,638,769 |