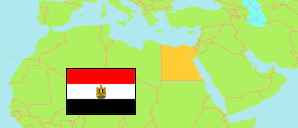
Ad-Daqahiyah
Governorate in Egypt
Contents: Subdivision
The population development in Ad-Daqahiyah as well as related information and services (Wikipedia, Google, images).
| Name | Status | Native | Population Census 1996-11-19 | Population Census 2006-11-11 | Population Census 2017-03-28 | Population Estimate 2023-07-01 | |
|---|---|---|---|---|---|---|---|
| Ad-Daqahiyah [Dakahlia] | Governorate | الدقهلية | 4,223,338 | 4,989,997 | 6,492,381 | 7,050,004 | |
| Ajā | Markaz | مركز أجا | 344,160 | 401,865 | 537,240 | 571,430 | → |
| Al-Jamāliyah | Markaz | مركز الجمالية | 67,703 | 83,529 | 137,454 | 154,457 | → |
| Al-Kurdy | Kism (fully urban) | قسم الكردى | 15,561 | 25,950 | 39,248 | 45,653 | → |
| Al-Manṣūrah [El Mansoura] | Markaz | مركز المنصورة | ... | 450,700 | 620,328 | 654,688 | → |
| Al-Manṣūrah 1 [El Mansoura] | Kism (fully urban) | قسم اول المنصورة | 207,251 | 244,665 | 310,350 | 361,019 | → |
| Al-Manṣūrah 2 [El Mansoura] | Kism (fully urban) | قسم ثان المنصورة | 162,158 | 194,683 | 233,231 | 271,311 | → |
| Al-Manzilah [Manzala] | Markaz | مركز المنزلة | 218,533 | 260,888 | 359,249 | 391,159 | → |
| Al-Maṭariyah [El Matareya] | Markaz | مركز المطرية | 105,260 | 125,770 | 177,577 | 202,672 | → |
| As-Sinbillāwayn [El Senbellawein] | Markaz | مركز السنبلاوين | 368,776 | 450,103 | 565,808 | 608,836 | → |
| Banī Ubayd | Markaz | مركز بنى عبيد | ... | 102,016 | 130,983 | 142,580 | → |
| Bilqās [Belqas] | Markaz | مركز بلقاس | 365,464 | 424,189 | 529,442 | 571,698 | → |
| Dikirnis | Markaz | مركز دكرنس | ... | 279,714 | 352,590 | 381,651 | → |
| Jamaṣah [Gamasa] | Kism (fully urban) | قسم جمصة | ... | 2,074 | 3,890 | 4,525 | → |
| Maḥallat Damanah | Markaz | مركز محلة دمنة | ... | 46,116 | 61,534 | 67,954 | → |
| Minyat an-Naṣr | Markaz | مركز منية النصر | 185,273 | 204,502 | 266,465 | 288,996 | → |
| Mīt Ghamr | Kism (fully urban) | قسم ميت غمر | 101,899 | 116,593 | 134,386 | 156,319 | → |
| Mīt Ghamr | Markaz | مركز ميت غمر | 428,509 | 517,209 | 662,184 | 698,863 | → |
| Mīt Salsīl | Markaz | مركز ميت سلسيل | 52,395 | 56,129 | 73,001 | 81,590 | → |
| Nabarūh | Markaz | مركز نبروة | ... | 219,048 | 282,180 | 303,387 | → |
| Shirbīn | Markaz | مركز شربين | 286,526 | 336,413 | 426,653 | 457,458 | → |
| Ṭalkhā | Markaz | مركز طلخا | ... | 306,195 | 391,015 | 423,319 | → |
| Timay al-Imdīd | Markaz | مركز تمى الأمديد | 120,804 | 141,646 | 197,573 | 210,439 | → |
| Miṣr [Egypt] | Republic | مِصر | 59,276,672 | 72,798,031 | 94,798,827 | 105,174,090 |
Source: Central Agency for Public Mobilization and Statistics (CAPMAS), Egypt.
Explanation: Some figures for 2006 are computed using preliminary census results. Area figures of districts are derived from geospatial data.
Further information about the population structure:
| Gender (E 2023) | |
|---|---|
| Males | 3,581,809 |
| Females | 3,468,195 |
| Age Groups (C 2017) | |
|---|---|
| 0-14 years | 2,205,567 |
| 15-64 years | 4,006,907 |
| 65+ years | 279,907 |
| Age Distribution (C 2017) | |
|---|---|
| 90+ years | 4,123 |
| 80-89 years | 30,137 |
| 70-79 years | 112,694 |
| 60-69 years | 332,712 |
| 50-59 years | 545,764 |
| 40-49 years | 673,137 |
| 30-39 years | 936,408 |
| 20-29 years | 1,049,035 |
| 10-19 years | 1,225,174 |
| 0-9 years | 1,583,197 |
| Urbanization (E 2023) | |
|---|---|
| Rural | 4,914,521 |
| Urban | 2,135,483 |