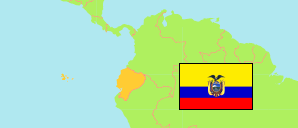
Playas
Canton in Ecuador
Contents: Population
The population development of Playas as well as related information and services (Wikipedia, Google, images).
| Name | Status | Population Census 1990-11-25 | Population Census 2001-11-25 | Population Census 2010-11-28 | Population Census 2022-11-30 | |
|---|---|---|---|---|---|---|
| Playas | Canton | 21,490 | 30,045 | 41,935 | 58,768 | |
| Ecuador | Republic | 9,697,979 | 12,156,608 | 14,483,499 | 16,938,986 |
Source: Instituto Nacional de Estadística y Censos del Ecuador.
Explanation: Census figures are not adjusted for underenumeration.
Further information about the population structure:
| Gender (C 2022) | |
|---|---|
| Males | 29,099 |
| Females | 29,669 |
| Age Groups (C 2022) | |
|---|---|
| 0-14 years | 17,653 |
| 15-64 years | 37,219 |
| 65+ years | 3,896 |
| Age Distribution (C 2022) | |
|---|---|
| 90+ years | 125 |
| 80-89 years | 599 |
| 70-79 years | 1,734 |
| 60-69 years | 3,407 |
| 50-59 years | 5,130 |
| 40-49 years | 6,861 |
| 30-39 years | 7,912 |
| 20-29 years | 9,713 |
| 10-19 years | 12,127 |
| 0-9 years | 11,160 |
| Urbanization (C 2022) | |
|---|---|
| Rural | 10,612 |
| Urban | 48,156 |
| Citizenship (C 2022) | |
|---|---|
| Ecuador | 57,547 |
| Other | 1,221 |
| Place of Birth (C 2022) | |
|---|---|
| Same parish | 35,168 |
| Other parish | 22,040 |
| Other country | 1,560 |
| Ethnic Group (C 2022) | |
|---|---|
| Indigenous | 524 |
| Afro-Ecuadorian | 3,469 |
| Montubios | 1,491 |
| Mestizos | 49,319 |
| White | 1,810 |
| Other Ethnic Group | 2,155 |