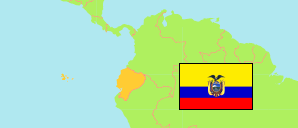
Orellana
Province in Ecuador
Contents: Subdivision
The population development in Orellana as well as related information and services (Wikipedia, Google, images).
| Name | Status | Population Census 1990-11-25 | Population Census 2001-11-25 | Population Census 2010-11-28 | Population Census 2022-11-30 | |
|---|---|---|---|---|---|---|
| Orellana | Province | 48,757 | 86,493 | 136,396 | 182,166 | |
| Aguarico (Awariku) | Canton | 3,150 | 4,658 | 4,847 | 6,872 | → |
| Francisco de Orellana (Orellana) | Canton | 19,674 | 42,010 | 72,795 | 95,130 | → |
| La Joya de los Sachas | Canton | 16,193 | 26,363 | 37,591 | 52,444 | → |
| Loreto (Luritu) | Canton | ... | 13,462 | 21,163 | 27,720 | → |
| Ecuador | Republic | 9,697,979 | 12,156,608 | 14,483,499 | 16,938,986 |
Source: Instituto Nacional de Estadística y Censos del Ecuador.
Explanation: Census figures are not adjusted for underenumeration.
Further information about the population structure:
| Gender (C 2022) | |
|---|---|
| Males | 92,241 |
| Females | 89,925 |
| Age Groups (C 2022) | |
|---|---|
| 0-14 years | 61,464 |
| 15-64 years | 112,665 |
| 65+ years | 8,037 |
| Age Distribution (C 2022) | |
|---|---|
| 90+ years | 197 |
| 80-89 years | 1,239 |
| 70-79 years | 3,357 |
| 60-69 years | 7,608 |
| 50-59 years | 12,548 |
| 40-49 years | 19,084 |
| 30-39 years | 26,519 |
| 20-29 years | 31,131 |
| 10-19 years | 41,035 |
| 0-9 years | 39,448 |
| Urbanization (C 2022) | |
|---|---|
| Rural | 108,828 |
| Urban | 73,338 |
| Citizenship (C 2022) | |
|---|---|
| Ecuador | 178,092 |
| Other | 4,074 |
| Place of Birth (C 2022) | |
|---|---|
| Same parish | 94,983 |
| Other parish | 81,897 |
| Other country | 5,286 |
| Ethnic Group (C 2022) | |
|---|---|
| Indigenous | 67,858 |
| Afro-Ecuadorian | 5,614 |
| Montubios | 1,131 |
| Mestizos | 106,278 |
| White | 1,262 |
| Other Ethnic Group | 23 |