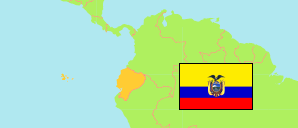
Tungurahua
Province in Ecuador
Contents: Subdivision
The population development in Tungurahua as well as related information and services (Wikipedia, Google, images).
| Name | Status | Population Census 1990-11-25 | Population Census 2001-11-25 | Population Census 2010-11-28 | Population Census 2022-11-30 | |
|---|---|---|---|---|---|---|
| Tungurahua (Tunkurawa) | Province | 368,511 | 441,034 | 504,583 | 563,532 | |
| Ambato (Ampatu) | Canton | 227,790 | 287,282 | 329,856 | 370,664 | → |
| Baños de Agua Santa | Canton | 15,416 | 16,112 | 20,018 | 21,908 | → |
| Cevallos | Canton | 5,964 | 6,873 | 8,163 | 10,433 | → |
| Mocha | Canton | 6,368 | 6,371 | 6,777 | 7,260 | → |
| Patate | Canton | 10,292 | 11,771 | 13,497 | 13,879 | → |
| Quero (Kiru) | Canton | 15,997 | 18,187 | 19,205 | 19,084 | → |
| San Pedro de Pelileo (Pelileo) | Canton | 37,619 | 48,988 | 56,573 | 63,897 | → |
| Santiago de Píllaro (Píllaro, Pillaru) | Canton | 33,369 | 34,925 | 38,357 | 42,497 | → |
| Tisaleo | Canton | 9,165 | 10,525 | 12,137 | 13,910 | → |
| Ecuador | Republic | 9,697,979 | 12,156,608 | 14,483,499 | 16,938,986 |
Source: Instituto Nacional de Estadística y Censos del Ecuador.
Explanation: Census figures are not adjusted for underenumeration.
Further information about the population structure:
| Gender (C 2022) | |
|---|---|
| Males | 271,101 |
| Females | 292,431 |
| Age Groups (C 2022) | |
|---|---|
| 0-14 years | 129,231 |
| 15-64 years | 373,858 |
| 65+ years | 60,443 |
| Age Distribution (C 2022) | |
|---|---|
| 90+ years | 2,887 |
| 80-89 years | 12,880 |
| 70-79 years | 25,910 |
| 60-69 years | 41,453 |
| 50-59 years | 57,086 |
| 40-49 years | 71,353 |
| 30-39 years | 82,344 |
| 20-29 years | 92,384 |
| 10-19 years | 95,530 |
| 0-9 years | 81,705 |
| Urbanization (C 2022) | |
|---|---|
| Rural | 338,283 |
| Urban | 225,249 |
| Citizenship (C 2022) | |
|---|---|
| Ecuador | 555,888 |
| Other | 7,644 |
| Place of Birth (C 2022) | |
|---|---|
| Same parish | 408,603 |
| Other parish | 143,031 |
| Other country | 11,898 |
| Ethnic Group (C 2022) | |
|---|---|
| Indigenous | 76,356 |
| Afro-Ecuadorian | 4,524 |
| Montubios | 1,886 |
| Mestizos | 473,452 |
| White | 7,135 |
| Other Ethnic Group | 179 |