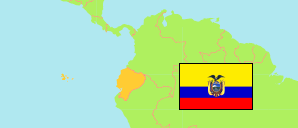
Pichincha
Province in Ecuador
Contents: Subdivision
The population development in Pichincha as well as related information and services (Wikipedia, Google, images).
| Name | Status | Population Census 1990-11-25 | Population Census 2001-11-25 | Population Census 2010-11-28 | Population Census 2022-11-30 | |
|---|---|---|---|---|---|---|
| Pichincha | Province | 1,565,403 | 2,101,799 | 2,576,287 | 3,089,473 | |
| Cayambe (Kayampi) | Canton | 46,938 | 69,800 | 85,795 | 105,267 | → |
| Mejía | Canton | 46,687 | 62,888 | 81,335 | 101,894 | → |
| Pedro Moncayo | Canton | 15,718 | 25,594 | 33,172 | 40,483 | → |
| Pedro Vicente Maldonado | Canton | ... | 9,965 | 12,924 | 15,475 | → |
| Puerto Quito | Canton | ... | 17,100 | 20,445 | 25,067 | → |
| Quito (Kitu) | Canton | 1,409,845 | 1,839,853 | 2,239,191 | 2,679,722 | → |
| Rumiñahui (Rumiñawi) | Canton | 46,215 | 65,882 | 85,852 | 107,904 | → |
| San Miguel de los Bancos (Los Bancos) | Canton | ... | 10,717 | 17,573 | 13,661 | → |
| Ecuador | Republic | 9,697,979 | 12,156,608 | 14,483,499 | 16,938,986 |
Source: Instituto Nacional de Estadística y Censos del Ecuador.
Explanation: Census figures are not adjusted for underenumeration.
Further information about the population structure:
| Gender (C 2022) | |
|---|---|
| Males | 1,490,557 |
| Females | 1,598,916 |
| Age Groups (C 2022) | |
|---|---|
| 0-14 years | 669,205 |
| 15-64 years | 2,123,756 |
| 65+ years | 296,512 |
| Age Distribution (C 2022) | |
|---|---|
| 90+ years | 13,563 |
| 80-89 years | 54,736 |
| 70-79 years | 126,698 |
| 60-69 years | 226,870 |
| 50-59 years | 312,808 |
| 40-49 years | 413,515 |
| 30-39 years | 491,894 |
| 20-29 years | 520,934 |
| 10-19 years | 515,348 |
| 0-9 years | 413,107 |
| Urbanization (C 2022) | |
|---|---|
| Rural | 1,131,394 |
| Urban | 1,958,079 |
| Citizenship (C 2022) | |
|---|---|
| Ecuador | 3,030,697 |
| Other | 58,776 |
| Place of Birth (C 2022) | |
|---|---|
| Same parish | 2,073,788 |
| Other parish | 890,619 |
| Other country | 125,066 |
| Ethnic Group (C 2022) | |
|---|---|
| Indigenous | 192,607 |
| Afro-Ecuadorian | 84,921 |
| Montubios | 22,452 |
| Mestizos | 2,700,205 |
| White | 87,253 |
| Other Ethnic Group | 2,035 |