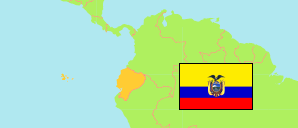
Napo
Province in Ecuador
Contents: Subdivision
The population development in Napo as well as related information and services (Wikipedia, Google, images).
| Name | Status | Population Census 1990-11-25 | Population Census 2001-11-25 | Population Census 2010-11-28 | Population Census 2022-11-30 | |
|---|---|---|---|---|---|---|
| Napo (Napu) | Province | 54,853 | 79,139 | 103,697 | 131,675 | |
| Archidona | Canton | 19,499 | 18,551 | 24,969 | 30,488 | → |
| Carlos Julio Arosemena Tola | Canton | ... | 2,943 | 3,664 | 4,647 | → |
| El Chaco (Chaku) | Canton | 4,445 | 6,133 | 7,960 | 9,252 | → |
| Quijos | Canton | 4,679 | 5,505 | 6,224 | 6,472 | → |
| Tena (Tina) | Canton | 35,747 | 46,007 | 60,880 | 80,816 | → |
| Ecuador | Republic | 9,697,979 | 12,156,608 | 14,483,499 | 16,938,986 |
Source: Instituto Nacional de Estadística y Censos del Ecuador.
Explanation: Census figures are not adjusted for underenumeration.
Further information about the population structure:
| Gender (C 2022) | |
|---|---|
| Males | 65,517 |
| Females | 66,158 |
| Age Groups (C 2022) | |
|---|---|
| 0-14 years | 42,421 |
| 15-64 years | 82,067 |
| 65+ years | 7,187 |
| Age Distribution (C 2022) | |
|---|---|
| 90+ years | 213 |
| 80-89 years | 1,144 |
| 70-79 years | 3,197 |
| 60-69 years | 6,290 |
| 50-59 years | 9,794 |
| 40-49 years | 14,222 |
| 30-39 years | 18,629 |
| 20-29 years | 21,741 |
| 10-19 years | 29,807 |
| 0-9 years | 26,638 |
| Urbanization (C 2022) | |
|---|---|
| Rural | 87,000 |
| Urban | 44,675 |
| Citizenship (C 2022) | |
|---|---|
| Ecuador | 130,439 |
| Other | 1,236 |
| Place of Birth (C 2022) | |
|---|---|
| Same parish | 77,601 |
| Other parish | 52,260 |
| Other country | 1,814 |
| Ethnic Group (C 2022) | |
|---|---|
| Indigenous | 85,528 |
| Afro-Ecuadorian | 1,653 |
| Montubios | 596 |
| Mestizos | 42,812 |
| White | 1,044 |
| Other Ethnic Group | 42 |