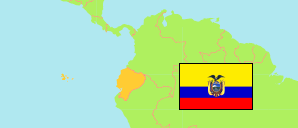
Manabí
Province in Ecuador
Contents: Subdivision
The population development in Manabí as well as related information and services (Wikipedia, Google, images).
| Name | Status | Population Census 1990-11-25 | Population Census 2001-11-25 | Population Census 2010-11-28 | Population Census 2022-11-30 | |
|---|---|---|---|---|---|---|
| Manabí (Manawi) | Province | 1,047,189 | 1,203,717 | 1,390,538 | 1,592,840 | |
| Bolívar | Canton | 37,580 | 35,627 | 40,735 | 41,827 | → |
| Chone (Chuni) | Canton | 115,646 | 117,634 | 126,491 | 128,166 | → |
| El Carmen | Canton | 54,070 | 69,998 | 89,021 | 120,936 | → |
| Flavio Alfaro | Canton | 23,613 | 25,390 | 25,004 | 26,415 | → |
| Jama | Canton | ... | 20,230 | 23,253 | 16,588 | → |
| Jaramijó | Canton | ... | 11,967 | 18,486 | 29,759 | → |
| Jipijapa | Canton | 82,807 | 65,796 | 71,083 | 78,117 | → |
| Junín (Hunin) | Canton | 17,992 | 18,491 | 18,942 | 22,324 | → |
| Manta | Canton | 132,816 | 192,322 | 226,477 | 271,145 | → |
| Montecristi | Canton | 37,660 | 43,400 | 70,294 | 99,937 | → |
| Olmedo | Canton | ... | 9,243 | 9,844 | 10,090 | → |
| Paján | Canton | 42,446 | 35,952 | 37,073 | 41,879 | → |
| Pedernales | Canton | ... | 46,876 | 55,128 | 70,408 | → |
| Pichincha | Canton | 28,827 | 29,945 | 30,244 | 30,380 | → |
| Portoviejo | Canton | 202,112 | 238,430 | 280,029 | 322,925 | → |
| Puerto López | Canton | ... | 16,626 | 20,451 | 25,630 | → |
| Rocafuerte | Canton | 26,021 | 29,321 | 33,469 | 42,688 | → |
| Santa Ana | Canton | 59,330 | 45,287 | 47,385 | 51,462 | → |
| San Vicente | Canton | ... | 19,116 | 22,025 | 24,997 | → |
| Sucre | Canton | 105,203 | 52,158 | 57,159 | 62,841 | → |
| Tosagua | Canton | 31,778 | 33,922 | 38,341 | 42,853 | → |
| Veinticuatro de Mayo (24 de Mayo) | Canton | 34,026 | 28,294 | 28,846 | 31,473 | → |
| Ecuador | Republic | 9,697,979 | 12,156,608 | 14,483,499 | 16,938,986 |
Source: Instituto Nacional de Estadística y Censos del Ecuador.
Explanation: Census figures are not adjusted for underenumeration.
Further information about the population structure:
| Gender (C 2022) | |
|---|---|
| Males | 787,046 |
| Females | 805,794 |
| Age Groups (C 2022) | |
|---|---|
| 0-14 years | 411,396 |
| 15-64 years | 1,038,015 |
| 65+ years | 143,429 |
| Age Distribution (C 2022) | |
|---|---|
| 90+ years | 6,303 |
| 80-89 years | 25,716 |
| 70-79 years | 61,788 |
| 60-69 years | 109,711 |
| 50-59 years | 156,602 |
| 40-49 years | 189,623 |
| 30-39 years | 215,545 |
| 20-29 years | 271,298 |
| 10-19 years | 296,386 |
| 0-9 years | 259,868 |
| Urbanization (C 2022) | |
|---|---|
| Rural | 668,515 |
| Urban | 924,325 |
| Citizenship (C 2022) | |
|---|---|
| Ecuador | 1,575,453 |
| Other | 17,387 |
| Place of Birth (C 2022) | |
|---|---|
| Same parish | 1,073,217 |
| Other parish | 489,737 |
| Other country | 29,886 |
| Ethnic Group (C 2022) | |
|---|---|
| Indigenous | 2,928 |
| Afro-Ecuadorian | 29,653 |
| Montubios | 534,600 |
| Mestizos | 1,001,147 |
| White | 22,505 |
| Other Ethnic Group | 2,007 |
