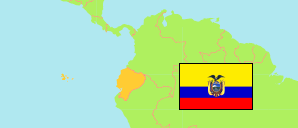
Imbabura
Province in Ecuador
Contents: Subdivision
The population development in Imbabura as well as related information and services (Wikipedia, Google, images).
| Name | Status | Population Census 1990-11-25 | Population Census 2001-11-25 | Population Census 2010-11-28 | Population Census 2022-11-30 | |
|---|---|---|---|---|---|---|
| Imbabura (Impapura) | Province | 278,240 | 348,105 | 403,546 | 469,879 | |
| Antonio Ante (Hatuntaki) | Canton | 27,375 | 36,053 | 43,518 | 53,771 | → |
| Cotacachi (Kutakachi) | Canton | 33,250 | 37,215 | 40,036 | 53,001 | → |
| Ibarra | Canton | 119,493 | 153,256 | 181,175 | 217,469 | → |
| Otavalo (Utawalu) | Canton | 56,286 | 90,188 | 104,874 | 114,303 | → |
| Pimampiro (Pimampiru) | Canton | 15,359 | 12,951 | 12,970 | 13,366 | → |
| San Miguel de Urcuquí (Urkuki) | Canton | 13,736 | 14,381 | 15,671 | 17,969 | → |
| Ecuador | Republic | 9,697,979 | 12,156,608 | 14,483,499 | 16,938,986 |
Source: Instituto Nacional de Estadística y Censos del Ecuador.
Explanation: Census figures are not adjusted for underenumeration.
Further information about the population structure:
| Gender (C 2022) | |
|---|---|
| Males | 226,633 |
| Females | 243,246 |
| Age Groups (C 2022) | |
|---|---|
| 0-14 years | 111,039 |
| 15-64 years | 310,591 |
| 65+ years | 48,249 |
| Age Distribution (C 2022) | |
|---|---|
| 90+ years | 2,479 |
| 80-89 years | 10,393 |
| 70-79 years | 20,937 |
| 60-69 years | 31,857 |
| 50-59 years | 44,931 |
| 40-49 years | 56,172 |
| 30-39 years | 67,230 |
| 20-29 years | 80,262 |
| 10-19 years | 87,457 |
| 0-9 years | 68,161 |
| Urbanization (C 2022) | |
|---|---|
| Rural | 224,251 |
| Urban | 245,628 |
| Citizenship (C 2022) | |
|---|---|
| Ecuador | 460,856 |
| Other | 9,023 |
| Place of Birth (C 2022) | |
|---|---|
| Same parish | 322,339 |
| Other parish | 132,183 |
| Other country | 15,357 |
| Ethnic Group (C 2022) | |
|---|---|
| Indigenous | 131,592 |
| Afro-Ecuadorian | 27,124 |
| Montubios | 1,209 |
| Mestizos | 304,926 |
| White | 4,894 |
| Other Ethnic Group | 134 |
