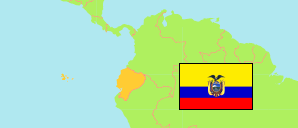
Chimborazo
Province in Ecuador
Contents: Subdivision
The population development in Chimborazo as well as related information and services (Wikipedia, Google, images).
| Name | Status | Population Census 1990-11-25 | Population Census 2001-11-25 | Population Census 2010-11-28 | Population Census 2022-11-30 | |
|---|---|---|---|---|---|---|
| Chimborazo (Chimpurasu) | Province | 366,636 | 403,632 | 458,581 | 471,933 | |
| Alausí (Alawsi) | Canton | 48,658 | 42,823 | 44,089 | 37,275 | → |
| Chambo (Champu) | Canton | 9,463 | 10,541 | 11,885 | 13,431 | → |
| Chunchi | Canton | 13,490 | 12,474 | 12,686 | 10,635 | → |
| Colta (Kulta) | Canton | 47,568 | 44,701 | 44,971 | 30,468 | → |
| Cumandá (Kumanta) | Canton | ... | 9,395 | 12,922 | 16,602 | → |
| Guamote (Wamuti) | Canton | 28,058 | 35,210 | 45,153 | 35,769 | → |
| Guano (Wanu) | Canton | 37,106 | 37,888 | 42,851 | 48,327 | → |
| Pallatanga (Pallatanka) | Canton | 9,482 | 10,800 | 11,544 | 11,796 | → |
| Penipe (Pinipi) | Canton | 7,078 | 6,485 | 6,739 | 6,748 | → |
| Riobamba (Rispampa) | Canton | 163,779 | 193,315 | 225,741 | 260,882 | → |
| Ecuador | Republic | 9,697,979 | 12,156,608 | 14,483,499 | 16,938,986 |
Source: Instituto Nacional de Estadística y Censos del Ecuador.
Explanation: Census figures are not adjusted for underenumeration.
Further information about the population structure:
| Gender (C 2022) | |
|---|---|
| Males | 223,460 |
| Females | 248,473 |
| Age Groups (C 2022) | |
|---|---|
| 0-14 years | 113,788 |
| 15-64 years | 304,415 |
| 65+ years | 53,730 |
| Age Distribution (C 2022) | |
|---|---|
| 90+ years | 2,536 |
| 80-89 years | 11,404 |
| 70-79 years | 23,620 |
| 60-69 years | 34,489 |
| 50-59 years | 44,664 |
| 40-49 years | 54,527 |
| 30-39 years | 63,957 |
| 20-29 years | 77,978 |
| 10-19 years | 88,791 |
| 0-9 years | 69,967 |
| Urbanization (C 2022) | |
|---|---|
| Rural | 247,266 |
| Urban | 224,667 |
| Citizenship (C 2022) | |
|---|---|
| Ecuador | 468,568 |
| Other | 3,365 |
| Place of Birth (C 2022) | |
|---|---|
| Same parish | 350,610 |
| Other parish | 115,459 |
| Other country | 5,864 |
| Ethnic Group (C 2022) | |
|---|---|
| Indigenous | 178,754 |
| Afro-Ecuadorian | 2,178 |
| Montubios | 1,063 |
| Mestizos | 286,356 |
| White | 3,521 |
| Other Ethnic Group | 61 |