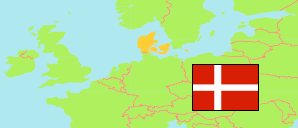
Viborg
in Viborg (Midtjylland)
Contents: Urban Settlement
The population development of Viborg as well as related information and services (weather, Wikipedia, Google, images).
| Name | Municipality | Population Estimate 2006-01-01 | Population Estimate 2011-01-01 | Population Estimate 2016-01-01 | Population Estimate 2021-01-01 | Population Estimate 2025-01-01 | |
|---|---|---|---|---|---|---|---|
| Viborg (incl. Bruunshåb) | Viborg | 34,922 | 36,737 | 40,685 | 41,880 | 43,645 | → |
Source: Denmark Statistik.
Further information about the population structure:
| Gender (E 2025) | |
|---|---|
| Males | 21,312 |
| Females | 22,333 |
| Age Groups (E 2025) | |
|---|---|
| 0-17 years | 8,794 |
| 18-64 years | 25,743 |
| 65+ years | 9,108 |
| Age Distribution (E 2025) | |
|---|---|
| 90+ years | 377 |
| 80-89 years | 2,146 |
| 70-79 years | 4,373 |
| 60-69 years | 4,767 |
| 50-59 years | 5,844 |
| 40-49 years | 5,256 |
| 30-39 years | 5,353 |
| 20-29 years | 5,337 |
| 10-19 years | 5,825 |
| 0-9 years | 4,367 |