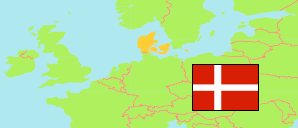
Bispebjerg
City District in Denmark
Contents: Subdivision
The population development in Bispebjerg as well as related information and services (Wikipedia, Google, images).
| Name | Status | Population Estimate 1981-01-01 | Population Estimate 1991-01-01 | Population Estimate 2001-01-01 | Population Estimate 2011-01-01 | Population Estimate 2016-01-01 | Population Estimate 2021-01-01 | Population Estimate 2025-01-01 | |
|---|---|---|---|---|---|---|---|---|---|
| Bispebjerg | City District | 44,285 | 42,014 | 44,641 | 49,163 | 54,583 | 54,466 | 55,508 | |
| Bispebjerg | Quarter | 7,041 | 5,310 | 5,552 | 5,812 | 6,526 | 6,237 | 6,246 | → |
| Bispebjerg Nordvest | Quarter | 23,292 | 22,958 | 24,156 | 27,983 | 31,400 | 31,858 | 32,392 | → |
| Emdrup | Quarter | 3,828 | 3,908 | 4,121 | 4,167 | 4,348 | 4,396 | 4,348 | → |
| Ryparken-Lundehus | Quarter | 4,990 | 5,034 | 5,284 | 5,650 | 6,109 | 5,954 | 6,556 | → |
| Utterslev | Quarter | 5,134 | 4,804 | 5,528 | 5,551 | 6,200 | 6,021 | 5,966 | → |
| København [Copenhagen] | City | 493,771 | 464,773 | 499,148 | 538,642 | 591,479 | 638,147 | 667,124 |
Source: Københavns Kommune Statistikbank.
Explanation: The total population figures include inhabitants assigned to no city district or quarter.
Further information about the population structure:
| Gender (E 2025) | |
|---|---|
| Males | 27,530 |
| Females | 27,978 |
| Age Groups (E 2025) | |
|---|---|
| 0-17 years | 8,259 |
| 18-64 years | 41,463 |
| 65+ years | 5,786 |
| Age Distribution (E 2025) | |
|---|---|
| 90+ years | 214 |
| 80-89 years | 1,106 |
| 70-79 years | 2,667 |
| 60-69 years | 4,107 |
| 50-59 years | 5,281 |
| 40-49 years | 6,191 |
| 30-39 years | 12,865 |
| 20-29 years | 14,062 |
| 10-19 years | 3,734 |
| 0-9 years | 5,281 |
| Citizenship (E 2025) | |
|---|---|
| Denmark | 43,224 |
| Other Citizenship | 12,284 |
| Place of Birth (E 2025) | |
|---|---|
| Copenhagen | 19,134 |
| Denmark | 20,647 |
| Faroe Islands & Greenland | 323 |
| Foreign country | 15,404 |