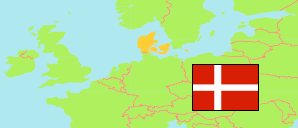
Herlev
Municipality in Hovedstaden (Denmark)
Contents: Population
The population development of Herlev as well as related information and services (Wikipedia, Google, images).
| Name | Status | Population Estimate 2006-01-01 | Population Estimate 2011-01-01 | Population Estimate 2016-01-01 | Population Estimate 2021-01-01 | Population Estimate 2024-01-01 | |
|---|---|---|---|---|---|---|---|
| Herlev | Municipality | 27,023 | 26,597 | 28,423 | 28,913 | 29,876 | |
| Danmark [Denmark] | Kingdom | 5,427,459 | 5,560,628 | 5,707,251 | 5,840,045 | 5,961,249 |
Source: Denmark Statistik.
Further information about the population structure:
| Gender (E 2024) | |
|---|---|
| Males | 14,676 |
| Females | 15,200 |
| Age Groups (E 2024) | |
|---|---|
| 0-17 years | 6,463 |
| 18-64 years | 17,641 |
| 65+ years | 5,772 |
| Age Distribution (E 2024) | |
|---|---|
| 90+ years | 295 |
| 80-89 years | 1,337 |
| 70-79 years | 2,525 |
| 60-69 years | 3,374 |
| 50-59 years | 3,811 |
| 40-49 years | 4,074 |
| 30-39 years | 3,847 |
| 20-29 years | 3,449 |
| 10-19 years | 3,774 |
| 0-9 years | 3,390 |
| Citizenship (E 2024) | |
|---|---|
| Denmark | 25,982 |
| EU 27 | 1,009 |
| Europe (other) | 1,207 |
| Asia | 1,370 |
| Other country | 308 |
| Country of Birth (E 2024) | |
|---|---|
| Denmark | 22,752 |
| EU 27 | 1,055 |
| Europe (other) | 2,288 |
| Asia | 2,989 |
| Other country | 789 |
| Urbanization (E 2022) | |
|---|---|
| Rural | 26 |
| Urban | 28,810 |