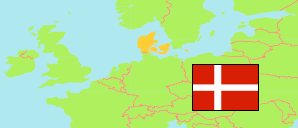
Syddanmark
Region in Denmark
Contents: Subdivision
The population development in Syddanmark as well as related information and services (Wikipedia, Google, images).
| Name | Status | Population Estimate 2006-01-01 | Population Estimate 2011-01-01 | Population Estimate 2016-01-01 | Population Estimate 2021-01-01 | Population Estimate 2025-01-01 | |
|---|---|---|---|---|---|---|---|
| Syddanmark [South Denmark] | Region | 1,185,851 | 1,200,656 | 1,211,770 | 1,223,634 | 1,240,472 | |
| Aabenraa | Municipality | 59,974 | 59,795 | 58,869 | 58,526 | 58,621 | → |
| Ærø | Municipality | 6,873 | 6,663 | 6,290 | 5,960 | 5,881 | → |
| Assens | Municipality | 41,369 | 41,635 | 41,224 | 40,867 | 40,469 | → |
| Billund | Municipality | 26,133 | 26,155 | 26,434 | 26,551 | 27,168 | → |
| Esbjerg | Municipality | 114,373 | 115,184 | 115,748 | 115,579 | 115,157 | → |
| Faaborg-Midtfyn | Municipality | 51,144 | 51,926 | 51,236 | 51,683 | 52,284 | → |
| Fanø | Municipality | 3,143 | 3,213 | 3,290 | 3,456 | 3,270 | → |
| Fredericia | Municipality | 49,252 | 50,104 | 50,689 | 51,275 | 52,616 | → |
| Haderslev | Municipality | 56,229 | 56,117 | 56,029 | 55,376 | 55,354 | → |
| Kerteminde | Municipality | 23,239 | 23,758 | 23,880 | 23,847 | 23,949 | → |
| Kolding | Municipality | 86,466 | 89,210 | 91,695 | 93,161 | 95,897 | → |
| Langeland | Municipality | 14,120 | 13,322 | 12,547 | 12,367 | 11,973 | → |
| Middelfart | Municipality | 36,417 | 37,701 | 37,913 | 39,116 | 40,318 | → |
| Nordfyn | Municipality | 28,876 | 29,507 | 29,298 | 29,549 | 29,342 | → |
| Nyborg | Municipality | 31,208 | 31,499 | 31,886 | 31,933 | 32,329 | → |
| Odense | Municipality | 186,595 | 190,245 | 198,972 | 205,509 | 210,803 | → |
| Sønderborg | Municipality | 76,598 | 76,193 | 74,737 | 73,831 | 74,096 | → |
| Svendborg | Municipality | 58,506 | 58,713 | 58,228 | 58,588 | 60,001 | → |
| Tønder | Municipality | 40,691 | 39,464 | 37,904 | 37,050 | 36,399 | → |
| Varde | Municipality | 50,056 | 50,351 | 50,289 | 49,628 | 49,410 | → |
| Vejen | Municipality | 41,551 | 42,683 | 42,869 | 42,790 | 42,702 | → |
| Vejle | Municipality | 103,038 | 107,218 | 111,743 | 116,992 | 122,433 | → |
| Danmark [Denmark] | Kingdom | 5,427,459 | 5,560,628 | 5,707,251 | 5,840,045 | 5,992,734 |
Source: Denmark Statistik.
Further information about the population structure:
| Gender (E 2025) | |
|---|---|
| Males | 620,155 |
| Females | 620,317 |
| Age Groups (E 2025) | |
|---|---|
| 0-17 years | 235,788 |
| 18-64 years | 719,233 |
| 65+ years | 285,451 |
| Age Distribution (E 2025) | |
|---|---|
| 90+ years | 11,200 |
| 80-89 years | 67,043 |
| 70-79 years | 131,779 |
| 60-69 years | 159,879 |
| 50-59 years | 171,005 |
| 40-49 years | 143,871 |
| 30-39 years | 148,054 |
| 20-29 years | 141,294 |
| 10-19 years | 142,256 |
| 0-9 years | 124,091 |
| Citizenship (E 2025) | |
|---|---|
| Denmark | 1,113,747 |
| EU 27 | 55,962 |
| Europe (other) | 28,623 |
| Asia | 30,808 |
| Other Citizenship | 11,326 |
| Country of Birth (E 2025) | |
|---|---|
| Denmark | 1,064,186 |
| EU 27 | 60,384 |
| Europe (other) | 42,653 |
| Asia | 57,104 |
| Other country | 16,093 |
| Urbanization (E 2025) | |
|---|---|
| Rural | 187,734 |
| Urban | 1,050,851 |