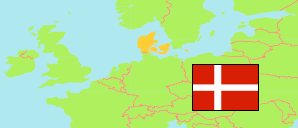
Nordjylland
Region in Denmark
Contents: Subdivision
The population development in Nordjylland as well as related information and services (Wikipedia, Google, images).
| Name | Status | Population Estimate 2006-01-01 | Population Estimate 2011-01-01 | Population Estimate 2016-01-01 | Population Estimate 2021-01-01 | Population Estimate 2025-01-01 | |
|---|---|---|---|---|---|---|---|
| Nordjylland [North Jutland] | Region | 576,807 | 579,829 | 585,499 | 590,439 | 592,768 | |
| Aalborg | Municipality | 193,529 | 199,188 | 210,316 | 219,487 | 224,612 | → |
| Brønderslev | Municipality | 35,313 | 35,789 | 36,047 | 36,177 | 36,706 | → |
| Frederikshavn | Municipality | 63,084 | 61,576 | 60,246 | 59,039 | 57,882 | → |
| Hjørring | Municipality | 67,480 | 66,473 | 65,411 | 64,155 | 63,311 | → |
| Jammerbugt | Municipality | 38,704 | 38,733 | 38,466 | 38,175 | 37,954 | → |
| Læsø | Municipality | 2,091 | 1,949 | 1,817 | 1,764 | 1,719 | → |
| Mariagerfjord | Municipality | 42,123 | 42,572 | 42,131 | 41,536 | 41,606 | → |
| Morsø | Municipality | 22,333 | 21,600 | 20,629 | 20,066 | 19,520 | → |
| Rebild | Municipality | 28,369 | 28,940 | 29,149 | 30,518 | 30,942 | → |
| Thisted | Municipality | 45,910 | 45,145 | 43,991 | 43,160 | 42,698 | → |
| Vesthimmerland | Municipality | 37,871 | 37,864 | 37,296 | 36,362 | 35,818 | → |
| Danmark [Denmark] | Kingdom | 5,427,459 | 5,560,628 | 5,707,251 | 5,840,045 | 5,992,734 |
Source: Denmark Statistik.
Further information about the population structure:
| Gender (E 2025) | |
|---|---|
| Males | 298,991 |
| Females | 293,777 |
| Age Groups (E 2025) | |
|---|---|
| 0-17 years | 109,198 |
| 18-64 years | 345,457 |
| 65+ years | 138,113 |
| Age Distribution (E 2025) | |
|---|---|
| 90+ years | 5,290 |
| 80-89 years | 32,101 |
| 70-79 years | 64,339 |
| 60-69 years | 76,709 |
| 50-59 years | 77,986 |
| 40-49 years | 66,520 |
| 30-39 years | 71,643 |
| 20-29 years | 74,849 |
| 10-19 years | 64,858 |
| 0-9 years | 58,473 |
| Citizenship (E 2025) | |
|---|---|
| Denmark | 546,508 |
| EU 27 | 17,152 |
| Europe (other) | 11,245 |
| Asia | 11,741 |
| Other Citizenship | 6,122 |
| Country of Birth (E 2025) | |
|---|---|
| Denmark | 532,616 |
| EU 27 | 18,432 |
| Europe (other) | 14,498 |
| Asia | 19,708 |
| Other country | 7,499 |
| Urbanization (E 2025) | |
|---|---|
| Rural | 104,069 |
| Urban | 488,014 |
