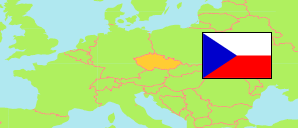
Zlín
District in Czech Republic
Contents: Population
The population development of Zlín as well as related information and services (Wikipedia, Google, images).
| Name | Status | Population Census 2001-03-01 | Population Census 2011-03-26 | Population Census 2021-03-26 | |
|---|---|---|---|---|---|
| Zlín | District | 196,126 | 191,263 | 187,371 | |
| Česká republika [Czech Republic] | Republic | 10,230,060 | 10,436,560 | 10,524,167 |
Source: Czech Statistical Office (web).
Further information about the population structure:
| Gender (C 2021) | |
|---|---|
| Males | 91,852 |
| Females | 95,519 |
| Age Groups (C 2021) | |
|---|---|
| 0-14 years | 28,854 |
| 15-64 years | 117,609 |
| 65+ years | 40,908 |
| Age Distribution (C 2021) | |
|---|---|
| 90+ years | 1,277 |
| 80-89 years | 8,180 |
| 70-79 years | 18,702 |
| 60-69 years | 24,691 |
| 50-59 years | 24,666 |
| 40-49 years | 30,695 |
| 30-39 years | 23,546 |
| 20-29 years | 17,976 |
| 10-19 years | 18,860 |
| 0-9 years | 18,778 |
| Citizenship (C 2021) | |
|---|---|
| Czechia | 182,977 |
| Slovakia | 1,413 |
| Ukraine | 904 |
| Other citizenship | 1,874 |
| Ethnic Group (C 2021) | |
|---|---|
| Czechs | 110,636 |
| Moravians | 28,383 |
| Slovaks | 2,315 |
| Ukrainians | 478 |
| Other ethnic groups | 3,852 |