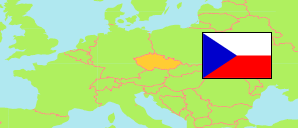
Královéhradecký kraj
Region in Czech Republic
Contents: Subdivision
The population development in Královéhradecký kraj as well as related information and services (Wikipedia, Google, images).
| Name | Status | Population Census 2001-03-01 | Population Census 2011-03-26 | Population Census 2021-03-26 | |
|---|---|---|---|---|---|
| Královéhradecký kraj [Hradec Králové Region] | Region | 550,724 | 547,916 | 538,303 | |
| Hradec Králové | District | 160,558 | 162,661 | 163,175 | → |
| Jičín | District | 77,761 | 79,702 | 78,704 | → |
| Náchod | District | 112,714 | 109,550 | 105,314 | → |
| Rychnov nad Kněžnou | District | 78,914 | 77,829 | 77,580 | → |
| Trutnov | District | 120,777 | 118,174 | 113,530 | → |
| Česká republika [Czech Republic] | Republic | 10,230,060 | 10,436,560 | 10,524,167 |
Source: Czech Statistical Office (web).
Further information about the population structure:
| Gender (C 2021) | |
|---|---|
| Males | 266,017 |
| Females | 272,286 |
| Age Groups (C 2021) | |
|---|---|
| 0-14 years | 84,677 |
| 15-64 years | 333,200 |
| 65+ years | 120,426 |
| Age Distribution (C 2021) | |
|---|---|
| 90+ years | 3,707 |
| 80-89 years | 21,192 |
| 70-79 years | 58,636 |
| 60-69 years | 69,545 |
| 50-59 years | 69,891 |
| 40-49 years | 86,762 |
| 30-39 years | 65,218 |
| 20-29 years | 53,041 |
| 10-19 years | 55,753 |
| 0-9 years | 54,558 |
| Citizenship (C 2021) | |
|---|---|
| Czechia | 521,341 |
| Slovakia | 2,601 |
| Ukraine | 5,545 |
| Other citizenship | 7,797 |
| Ethnic Group (C 2021) | |
|---|---|
| Czechs | 345,197 |
| Moravians | 1,693 |
| Slovaks | 5,577 |
| Ukrainians | 3,416 |
| Other ethnic groups | 11,367 |
