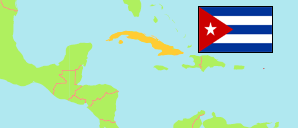
Matanzas
Province in Cuba
Contents: Subdivision
The population development in Matanzas as well as related information and services (Wikipedia, Google, images).
| Name | Status | Population Census 2002-09-06 | Population Census 2012-09-14 | Population Estimate 2022-12-31 | |
|---|---|---|---|---|---|
| Matanzas | Province | 670,427 | 694,476 | 710,127 | |
| Calimete | Municipality | 29,786 | 28,751 | 27,210 | → |
| Cárdenas | Municipality | 125,341 | 143,593 | 158,322 | → |
| Ciénaga de Zapata | Municipality | 8,616 | 9,163 | 10,394 | → |
| Colón | Municipality | 71,404 | 70,248 | 68,021 | → |
| Jagüey Grande | Municipality | 56,759 | 59,722 | 59,600 | → |
| Jovellanos | Municipality | 58,123 | 57,683 | 57,216 | → |
| Limonar | Municipality | 25,198 | 26,331 | 26,708 | → |
| Los Arabos | Municipality | 25,863 | 24,787 | 23,111 | → |
| Martí | Municipality | 24,115 | 22,786 | 21,582 | → |
| Matanzas | Municipality | 141,400 | 151,624 | 163,631 | → |
| Pedro Betancourt | Municipality | 32,266 | 31,555 | 29,565 | → |
| Perico | Municipality | 31,160 | 31,191 | 29,746 | → |
| Unión de Reyes | Municipality | 40,396 | 37,042 | 35,021 | → |
| Cuba | Republic | 11,177,743 | 11,167,325 | 11,089,511 |
Source: Oficina Nacional de Estadísticas, Cuba.
Further information about the population structure:
| Gender (E 2022) | |
|---|---|
| Males | 353,472 |
| Females | 356,655 |
| Age Groups (E 2019) | |
|---|---|
| 0-14 years | 111,028 |
| 15-64 years | 495,146 |
| 65+ years | 110,586 |
| Age Distribution (E 2019) | |
|---|---|
| 0-9 years | 76,594 |
| 10-19 years | 74,570 |
| 20-29 years | 96,044 |
| 30-39 years | 92,409 |
| 40-49 years | 109,381 |
| 50-59 years | 120,029 |
| 60-69 years | 72,282 |
| 70-79 years | 51,172 |
| 80+ years | 24,279 |
| Urbanization (E 2022) | |
|---|---|
| Rural | 116,935 |
| Urban | 593,192 |
| Ethnic Group (C 2012) | |
|---|---|
| White | 513,217 |
| Black | 181,259 |
| Mestizo, Mulatto | 70,831 |