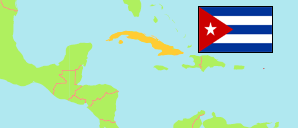
Ciudad de la Habana
City in Cuba
Contents: Subdivision
The population development in Ciudad de la Habana as well as related information and services (Wikipedia, Google, images).
| Name | Status | Population Census 2002-09-06 | Population Census 2012-09-14 | Population Estimate 2022-12-31 | |
|---|---|---|---|---|---|
| Ciudad de la Habana [Havana] | City | 2,201,610 | 2,106,146 | 2,137,847 | |
| Arroyo Naranjo | Municipality | 209,163 | 200,451 | 206,918 | → |
| Boyeros | Municipality | 187,835 | 188,217 | 204,003 | → |
| Centro Habana | Municipality | 159,794 | 140,234 | 132,451 | → |
| Cerro | Municipality | 132,812 | 122,999 | 124,994 | → |
| Cotorro | Municipality | 74,174 | 77,066 | 83,115 | → |
| Diez de Octubre | Municipality | 229,937 | 206,052 | 199,933 | → |
| Guanabacoa | Municipality | 112,702 | 115,180 | 128,666 | → |
| La Habana del Este | Municipality | 178,271 | 174,493 | 173,457 | → |
| La Habana Vieja [Old Havana] | Municipality | 96,763 | 87,772 | 79,845 | → |
| La Lisa | Municipality | 130,096 | 136,231 | 147,415 | → |
| Marianao | Municipality | 135,683 | 134,529 | 134,057 | → |
| Playa | Municipality | 187,985 | 179,647 | 178,601 | → |
| Plaza de la Revolución | Municipality | 163,034 | 147,789 | 139,135 | → |
| Regla | Municipality | 44,450 | 42,420 | 44,185 | → |
| San Miguel del Padrón | Municipality | 158,911 | 153,066 | 161,072 | → |
| Cuba | Republic | 11,177,743 | 11,167,325 | 11,089,511 |
Source: Oficina Nacional de Estadísticas, Cuba.
Further information about the population structure:
| Gender (E 2022) | |
|---|---|
| Males | 1,017,586 |
| Females | 1,120,261 |
| Age Groups (E 2019) | |
|---|---|
| 0-14 years | 309,786 |
| 15-64 years | 1,473,903 |
| 65+ years | 348,705 |
| Age Distribution (E 2019) | |
|---|---|
| 0-9 years | 211,240 |
| 10-19 years | 218,557 |
| 20-29 years | 274,113 |
| 30-39 years | 274,797 |
| 40-49 years | 302,770 |
| 50-59 years | 383,444 |
| 60-69 years | 227,518 |
| 70-79 years | 157,195 |
| 80+ years | 82,760 |
| Urbanization (E 2022) | |
|---|---|
| Urban | 2,137,847 |
| Ethnic Group (C 2012) | |
|---|---|
| White | 1,230,682 |
| Black | 875,464 |
| Mestizo, Mulatto | 320,149 |