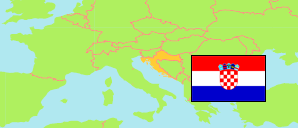
Croatia: City of Zagreb
Contents: City Districts
The population of the city districts of Zagreb by census year.
| Name | Status | Population Census 2001-03-31 | Population Census 2011-03-31 | Population Census 2021-08-31 | |
|---|---|---|---|---|---|
| Grad Zagreb [City of Zagreb] | City | 779,145 | 790,017 | 767,131 |
Source: Croatian Bureau of Statistics (web).
Explanation: Area figures are derived from geospatial data.
Further information about the population structure:
| Gender (C 2021) | |
|---|---|
| Males | 358,616 |
| Females | 408,515 |
| Age Groups (C 2021) | |
|---|---|
| 0-14 years | 116,644 |
| 15-64 years | 491,714 |
| 65+ years | 158,773 |
| Age Distribution (C 2021) | |
|---|---|
| 90+ years | 5,034 |
| 80-89 years | 35,066 |
| 70-79 years | 70,225 |
| 60-69 years | 97,012 |
| 50-59 years | 99,304 |
| 40-49 years | 113,827 |
| 30-39 years | 108,664 |
| 20-29 years | 86,881 |
| 10-19 years | 73,502 |
| 0-9 years | 77,616 |
| Citizenship (C 2021) | |
|---|---|
| Croatian | 760,442 |
| Foreign Citizenship / Stateless | 6,652 |
| Ethnic Group (C 2021) | |
|---|---|
| Croats | 717,526 |
| Serbs | 12,034 |
| Other group | 23,633 |
| Religion (C 2021) | |
|---|---|
| Catholic | 562,825 |
| Orthodox | 10,949 |
| Other Christians | 39,352 |
| Muslim | 15,499 |
| Other religion | 12,617 |
| No religion | 86,066 |