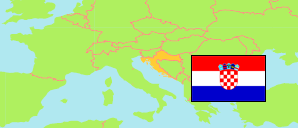
Knin
Town in Šibenik-Knin
Town
The population development of Knin.
| Name | Status | Population Census 2001-03-31 | Population Census 2011-03-31 | Population Census 2021-08-31 | |
|---|---|---|---|---|---|
| Knin | Town | 15,190 | 15,407 | 11,633 | → |
| Šibenik-Knin | County | 112,891 | 109,375 | 96,381 |
Contents: Settlements
The population development of the settlements in Knin.
| Name | Status | Municipality | Population Census 2001-03-31 | Population Census 2011-03-31 | Population Census 2021-08-31 | |
|---|---|---|---|---|---|---|
| Golubić | Settlement | Knin | 654 | 1,029 | 654 | → |
| Knin | Settlement | Knin | 11,128 | 10,633 | 8,262 | → |
| Kninsko Polje | Settlement | Knin | 536 | 864 | 758 | → |
| Kovačić | Settlement | Knin | 915 | 900 | 628 | → |
| Ljubač | Settlement | Knin | 87 | 78 | 51 | → |
| Oćestovo | Settlement | Knin | 160 | 144 | 78 | → |
| Plavno | Settlement | Knin | 266 | 253 | 121 | → |
| Polača | Settlement | Knin | 134 | 210 | 151 | → |
| Potkonje | Settlement | Knin | 85 | 110 | 66 | → |
| Strmica | Settlement | Knin | 268 | 261 | 160 | → |
| Vrpolje | Settlement | Knin | 204 | 213 | 159 | → |
| Žagrović | Settlement | Knin | 648 | 637 | 509 | → |
Source: Croatian Bureau of Statistics (web).
Explanation: Area figures are computed by using geospatial data.