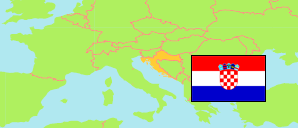
Lovreć
Municipality in Croatia
Contents: Population
The population development of Lovreć as well as related information and services (Wikipedia, Google, images).
| Name | Status | Population Census 2001-03-31 | Population Census 2011-03-31 | Population Census 2021-08-31 | Population Estimate 2023-12-31 | ||||||||||||||
|---|---|---|---|---|---|---|---|---|---|---|---|---|---|---|---|---|---|---|---|
| Lovreć | Municipality | 2,500 | 1,699 | 1,402 | 1,371 | ||||||||||||||
Lovreć 1,371 Population [2023] – Estimate 106.0 km² Area 12.93/km² Population Density [2023] -0.95% Annual Population Change [2021 → 2023] | |||||||||||||||||||
| Hrvatska [Croatia] | Republic | 4,437,460 | 4,284,889 | 3,871,833 | 3,861,967 | ||||||||||||||
Source: Croatian Bureau of Statistics.
Explanation: Area figures are calculated using geospatial data.
Further information about the population structure:
| Gender (E 2023) | |
|---|---|
| Males | 714 |
| Females | 657 |
| Age Groups (C 2021) | |
|---|---|
| 0-14 years | 153 |
| 15-64 years | 842 |
| 65+ years | 407 |
| Age Distribution (C 2021) | |
|---|---|
| 90+ years | 9 |
| 80-89 years | 105 |
| 70-79 years | 176 |
| 60-69 years | 215 |
| 50-59 years | 189 |
| 40-49 years | 141 |
| 30-39 years | 144 |
| 20-29 years | 204 |
| 10-19 years | 117 |
| 0-9 years | 102 |
| Citizenship (C 2021) | |
|---|---|
| Croatia | 1,401 |
| Foreign Citizenship / Stateless | 1 |
| Ethnic Group (C 2021) | |
|---|---|
| Croats | 1,396 |
| Other group | 3 |
| Religion (C 2021) | |
|---|---|
| Catholics | 1,358 |
| Other Christians | 27 |
| Muslims | 2 |
| Other religion | 2 |
| No religion | 6 |
