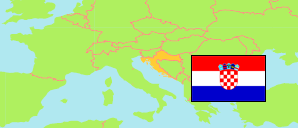
Međimurje
County in Croatia
Contents: Subdivision
The population development in Međimurje as well as related information and services (Wikipedia, Google, images).
| Name | Status | Population Census 2001-03-31 | Population Census 2011-03-31 | Population Census 2021-08-31 | Population Estimate 2023-12-31 | |
|---|---|---|---|---|---|---|
| Međimurje | County | 118,426 | 113,804 | 105,250 | 105,010 | |
| Belica | Municipality | 3,509 | 3,176 | 2,822 | 2,774 | → |
| Čakovec | Town | 28,279 | 27,820 | 27,122 | 27,731 | → |
| Dekanovec | Municipality | 832 | 774 | 739 | 714 | → |
| Domašinec | Municipality | 2,459 | 2,251 | 1,923 | 1,812 | → |
| Donja Dubrava | Municipality | 2,274 | 1,920 | 1,658 | 1,644 | → |
| Donji Kraljevec | Municipality | 4,931 | 4,659 | 4,043 | 4,155 | → |
| Donji Vidovec | Municipality | 1,595 | 1,399 | 1,197 | 1,152 | → |
| Goričan | Municipality | 3,148 | 2,823 | 2,343 | 2,244 | → |
| Gornji Mihaljevec | Municipality | 2,046 | 1,917 | 1,740 | 1,677 | → |
| Kotoriba | Municipality | 3,333 | 3,224 | 2,938 | 2,863 | → |
| Mala Subotica | Municipality | 4,923 | 4,736 | 4,344 | 4,306 | → |
| Mursko Središće | Town | 6,548 | 6,307 | 5,855 | 5,692 | → |
| Nedelišće | Municipality | 11,544 | 11,975 | 11,017 | 11,073 | → |
| Orehovica | Municipality | 2,769 | 2,685 | 2,720 | 2,715 | → |
| Podturen | Municipality | 4,392 | 3,873 | 3,517 | 3,396 | → |
| Prelog | Town | 7,871 | 7,815 | 7,027 | 7,065 | → |
| Pribislavec | Municipality | 2,929 | 3,136 | 2,963 | 2,991 | → |
| Selnica | Municipality | 3,442 | 2,991 | 2,636 | 2,555 | → |
| Šenkovec | Municipality | 2,770 | 2,879 | 2,708 | 2,691 | → |
| Strahoninec | Municipality | 2,728 | 2,682 | 2,598 | 2,679 | → |
| Štrigova | Municipality | 3,221 | 2,766 | 2,357 | 2,320 | → |
| Sveta Marija | Municipality | 2,433 | 2,317 | 1,990 | 1,916 | → |
| Sveti Juraj na Bregu | Municipality | 5,279 | 5,090 | 4,929 | 4,846 | → |
| Sveti Martin na Muri | Municipality | 2,958 | 2,605 | 2,391 | 2,373 | → |
| Vratišinec | Municipality | 2,213 | 1,984 | 1,673 | 1,626 | → |
| Hrvatska [Croatia] | Republic | 4,437,460 | 4,284,889 | 3,871,833 | 3,861,967 |
Source: Croatian Bureau of Statistics.
Explanation: Area figures are calculated using geospatial data.
Further information about the population structure:
| Gender (E 2023) | |
|---|---|
| Males | 51,751 |
| Females | 53,259 |
| Age Groups (C 2021) | |
|---|---|
| 0-14 years | 16,886 |
| 15-64 years | 66,707 |
| 65+ years | 21,657 |
| Age Distribution (C 2021) | |
|---|---|
| 90+ years | 631 |
| 80-89 years | 4,328 |
| 70-79 years | 9,401 |
| 60-69 years | 15,105 |
| 50-59 years | 14,446 |
| 40-49 years | 14,161 |
| 30-39 years | 12,974 |
| 20-29 years | 11,626 |
| 10-19 years | 11,518 |
| 0-9 years | 11,060 |
| Citizenship (C 2021) | |
|---|---|
| Croatian | 104,515 |
| Foreign Citizenship / Stateless | 734 |
| Ethnic Group (C 2021) | |
|---|---|
| Croats | 95,069 |
| Serbs | 187 |
| Other group | 8,357 |
| Religion (C 2021) | |
|---|---|
| Catholic | 81,845 |
| Orthodox | 282 |
| Other Christians | 12,642 |
| Muslim | 358 |
| Other religion | 879 |
| No religion | 4,336 |
