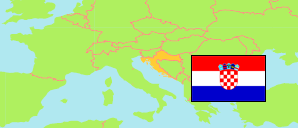
Zadar
County in Croatia
Contents: Subdivision
The population development in Zadar as well as related information and services (Wikipedia, Google, images).
| Name | Status | Population Census 2001-03-31 | Population Census 2011-03-31 | Population Census 2021-08-31 | Population Estimate 2023-12-31 | |
|---|---|---|---|---|---|---|
| Zadar | County | 162,045 | 170,017 | 159,766 | 163,221 | |
| Benkovac | Town | 9,786 | 11,026 | 9,680 | 9,121 | → |
| Bibinje | Municipality | 3,923 | 3,985 | 3,962 | 4,087 | → |
| Biograd na Moru | Town | 5,259 | 5,569 | 5,601 | 5,901 | → |
| Galovac | Municipality | 1,190 | 1,234 | 1,258 | 1,251 | → |
| Gračac | Municipality | 3,923 | 4,690 | 3,136 | 2,919 | → |
| Jasenice | Municipality | 1,329 | 1,398 | 1,348 | 1,401 | → |
| Kali | Municipality | 1,731 | 1,638 | 1,585 | 1,648 | → |
| Kolan | Municipality | 715 | 791 | 815 | 851 | → |
| Kukljica | Municipality | 650 | 714 | 628 | 634 | → |
| Lišane Ostrovičke | Municipality | 764 | 698 | 593 | 551 | → |
| Nin | Town | 2,150 | 2,744 | 2,705 | 3,038 | → |
| Novigrad | Town | 2,368 | 2,375 | 2,160 | 2,115 | → |
| Obrovac | Town | 3,387 | 4,323 | 3,453 | 3,378 | → |
| Pag | Town | 3,635 | 3,846 | 3,175 | 3,238 | → |
| Pakoštane | Municipality | 3,884 | 4,123 | 4,100 | 4,268 | → |
| Pašman | Municipality | 2,004 | 2,082 | 2,136 | 2,235 | → |
| Polača | Municipality | 1,434 | 1,468 | 1,389 | 1,387 | → |
| Poličnik | Municipality | 4,664 | 4,469 | 4,676 | 4,846 | → |
| Posedarje | Municipality | 3,513 | 3,607 | 3,430 | 3,434 | → |
| Povljana | Municipality | 713 | 759 | 669 | 666 | → |
| Preko | Municipality | 3,871 | 3,805 | 3,556 | 3,627 | → |
| Privlaka | Municipality | 2,199 | 2,253 | 2,128 | 2,281 | → |
| Ražanac | Municipality | 3,107 | 2,940 | 2,746 | 2,751 | → |
| Sali | Municipality | 1,820 | 1,698 | 1,746 | 1,947 | → |
| Škabrnja | Municipality | 1,772 | 1,776 | 1,661 | 1,651 | → |
| Stankovci | Municipality | 2,088 | 2,003 | 1,831 | 1,792 | → |
| Starigrad | Municipality | 1,893 | 1,876 | 1,697 | 1,734 | → |
| Sukošan | Municipality | 4,402 | 4,583 | 4,665 | 4,872 | → |
| Sveti Filip i Jakov | Municipality | 4,482 | 4,606 | 4,461 | 4,652 | → |
| Tkon | Municipality | 707 | 763 | 748 | 756 | → |
| Vir | Municipality | 1,608 | 3,000 | 3,045 | 3,155 | → |
| Vrsi | Municipality | 2,453 | 2,053 | 2,045 | 2,111 | → |
| Zadar | Town | 72,718 | 75,062 | 70,779 | 72,716 | → |
| Zemunik Donji | Municipality | 1,903 | 2,060 | 2,159 | 2,207 | → |
| Hrvatska [Croatia] | Republic | 4,437,460 | 4,284,889 | 3,871,833 | 3,861,967 |
Source: Croatian Bureau of Statistics.
Explanation: Area figures are calculated using geospatial data.
Further information about the population structure:
| Gender (E 2023) | |
|---|---|
| Males | 80,239 |
| Females | 82,982 |
| Age Groups (C 2021) | |
|---|---|
| 0-14 years | 23,264 |
| 15-64 years | 98,211 |
| 65+ years | 38,291 |
| Age Distribution (C 2021) | |
|---|---|
| 90+ years | 1,050 |
| 80-89 years | 8,436 |
| 70-79 years | 17,146 |
| 60-69 years | 23,213 |
| 50-59 years | 21,111 |
| 40-49 years | 21,011 |
| 30-39 years | 18,910 |
| 20-29 years | 17,698 |
| 10-19 years | 16,131 |
| 0-9 years | 15,060 |
| Citizenship (C 2021) | |
|---|---|
| Croatia | 158,261 |
| Foreign Citizenship / Stateless | 1,483 |
| Ethnic Group (C 2021) | |
|---|---|
| Croats | 149,447 |
| Serbs | 5,955 |
| Other group | 3,073 |
| Religion (C 2021) | |
|---|---|
| Catholics | 136,107 |
| Orthodox | 6,093 |
| Other Christians | 5,461 |
| Muslims | 1,127 |
| Other religion | 1,035 |
| No religion | 6,393 |
